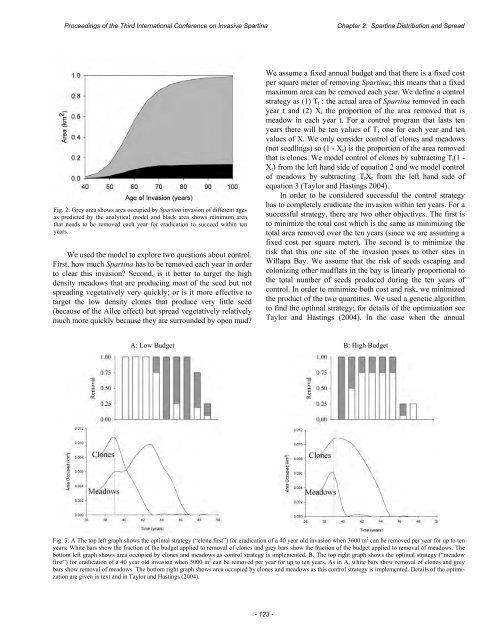
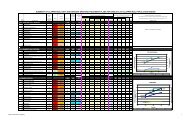
<str<strong>on</strong>g>Proceedings</str<strong>on</strong>g> <str<strong>on</strong>g>of</str<strong>on</strong>g> <str<strong>on</strong>g>the</str<strong>on</strong>g> <str<strong>on</strong>g>Third</str<strong>on</strong>g> <str<strong>on</strong>g>Internati<strong>on</strong>al</str<strong>on</strong>g> <str<strong>on</strong>g>C<strong>on</strong>ference</str<strong>on</strong>g> <strong>on</strong> <strong>Invasive</strong> SpartinaChapter 2: Spartina Distributi<strong>on</strong> and SpreadFig. 2: Grey area shows area occupied by Spartina invasi<strong>on</strong> <str<strong>on</strong>g>of</str<strong>on</strong>g> different agesas predicted by <str<strong>on</strong>g>the</str<strong>on</strong>g> analytical model and black area shows minimum areathat needs to be removed each year for eradicati<strong>on</strong> to succeed within tenyears.We used <str<strong>on</strong>g>the</str<strong>on</strong>g> model to explore two questi<strong>on</strong>s about c<strong>on</strong>trol.First, how much Spartina has to be removed each year in orderto clear this invasi<strong>on</strong>? Sec<strong>on</strong>d, is it better to target <str<strong>on</strong>g>the</str<strong>on</strong>g> highdensity meadows that are producing most <str<strong>on</strong>g>of</str<strong>on</strong>g> <str<strong>on</strong>g>the</str<strong>on</strong>g> seed but notspreading vegetatively very quickly; or is it more effective totarget <str<strong>on</strong>g>the</str<strong>on</strong>g> low density cl<strong>on</strong>es that produce very little seed(because <str<strong>on</strong>g>of</str<strong>on</strong>g> <str<strong>on</strong>g>the</str<strong>on</strong>g> Allee effect) but spread vegetatively relativelymuch more quickly because <str<strong>on</strong>g>the</str<strong>on</strong>g>y are surrounded by open mud?We assume a fixed annual budget and that <str<strong>on</strong>g>the</str<strong>on</strong>g>re is a fixed costper square meter <str<strong>on</strong>g>of</str<strong>on</strong>g> removing Spartina; this means that a fixedmaximum area can be removed each year. We define a c<strong>on</strong>trolstrategy as (1) T t : <str<strong>on</strong>g>the</str<strong>on</strong>g> actual area <str<strong>on</strong>g>of</str<strong>on</strong>g> Spartina removed in eachyear t and (2) X t <str<strong>on</strong>g>the</str<strong>on</strong>g> proporti<strong>on</strong> <str<strong>on</strong>g>of</str<strong>on</strong>g> <str<strong>on</strong>g>the</str<strong>on</strong>g> area removed that ismeadow in each year t. For a c<strong>on</strong>trol program that lasts tenyears <str<strong>on</strong>g>the</str<strong>on</strong>g>re will be ten values <str<strong>on</strong>g>of</str<strong>on</strong>g> T, <strong>on</strong>e for each year and tenvalues <str<strong>on</strong>g>of</str<strong>on</strong>g> X. We <strong>on</strong>ly c<strong>on</strong>sider c<strong>on</strong>trol <str<strong>on</strong>g>of</str<strong>on</strong>g> cl<strong>on</strong>es and meadows(not seedlings) so (1 - X t ) is <str<strong>on</strong>g>the</str<strong>on</strong>g> proporti<strong>on</strong> <str<strong>on</strong>g>of</str<strong>on</strong>g> <str<strong>on</strong>g>the</str<strong>on</strong>g> area removedthat is cl<strong>on</strong>es. We model c<strong>on</strong>trol <str<strong>on</strong>g>of</str<strong>on</strong>g> cl<strong>on</strong>es by subtracting T t (1 -X t ) from <str<strong>on</strong>g>the</str<strong>on</strong>g> left hand side <str<strong>on</strong>g>of</str<strong>on</strong>g> equati<strong>on</strong> 2 and we model c<strong>on</strong>trol<str<strong>on</strong>g>of</str<strong>on</strong>g> meadows by subtracting T t X t from <str<strong>on</strong>g>the</str<strong>on</strong>g> left hand side <str<strong>on</strong>g>of</str<strong>on</strong>g>equati<strong>on</strong> 3 (Taylor and Hastings 2004).In order to be c<strong>on</strong>sidered successful <str<strong>on</strong>g>the</str<strong>on</strong>g> c<strong>on</strong>trol strategyhas to completely eradicate <str<strong>on</strong>g>the</str<strong>on</strong>g> invasi<strong>on</strong> within ten years. For asuccessful strategy, <str<strong>on</strong>g>the</str<strong>on</strong>g>re are two o<str<strong>on</strong>g>the</str<strong>on</strong>g>r objectives. The first isto minimize <str<strong>on</strong>g>the</str<strong>on</strong>g> total cost which is <str<strong>on</strong>g>the</str<strong>on</strong>g> same as minimizing <str<strong>on</strong>g>the</str<strong>on</strong>g>total area removed over <str<strong>on</strong>g>the</str<strong>on</strong>g> ten years (since we are assuming afixed cost per square meter). The sec<strong>on</strong>d is to minimize <str<strong>on</strong>g>the</str<strong>on</strong>g>risk that this <strong>on</strong>e site <str<strong>on</strong>g>of</str<strong>on</strong>g> <str<strong>on</strong>g>the</str<strong>on</strong>g> invasi<strong>on</strong> poses to o<str<strong>on</strong>g>the</str<strong>on</strong>g>r sites inWillapa Bay. We assume that <str<strong>on</strong>g>the</str<strong>on</strong>g> risk <str<strong>on</strong>g>of</str<strong>on</strong>g> seeds escaping andcol<strong>on</strong>izing o<str<strong>on</strong>g>the</str<strong>on</strong>g>r mudflats in <str<strong>on</strong>g>the</str<strong>on</strong>g> bay is linearly proporti<strong>on</strong>al to<str<strong>on</strong>g>the</str<strong>on</strong>g> total number <str<strong>on</strong>g>of</str<strong>on</strong>g> seeds produced during <str<strong>on</strong>g>the</str<strong>on</strong>g> ten years <str<strong>on</strong>g>of</str<strong>on</strong>g>c<strong>on</strong>trol. In order to minimize both cost and risk, we minimized<str<strong>on</strong>g>the</str<strong>on</strong>g> product <str<strong>on</strong>g>of</str<strong>on</strong>g> <str<strong>on</strong>g>the</str<strong>on</strong>g> two quantities. We used a genetic algorithmto find <str<strong>on</strong>g>the</str<strong>on</strong>g> optimal strategy; for details <str<strong>on</strong>g>of</str<strong>on</strong>g> <str<strong>on</strong>g>the</str<strong>on</strong>g> optimizati<strong>on</strong> seeTaylor and Hastings (2004). In <str<strong>on</strong>g>the</str<strong>on</strong>g> case when <str<strong>on</strong>g>the</str<strong>on</strong>g> annualA: Low BudgetB: High BudgetFig. 3: A The top left graph shows <str<strong>on</strong>g>the</str<strong>on</strong>g> optimal strategy (“cl<strong>on</strong>e first”) for eradicati<strong>on</strong> <str<strong>on</strong>g>of</str<strong>on</strong>g> a 40 year old invasi<strong>on</strong> when 3600 m 2 can be removed per year for up to tenyears. White bars show <str<strong>on</strong>g>the</str<strong>on</strong>g> fracti<strong>on</strong> <str<strong>on</strong>g>of</str<strong>on</strong>g> <str<strong>on</strong>g>the</str<strong>on</strong>g> budget applied to removal <str<strong>on</strong>g>of</str<strong>on</strong>g> cl<strong>on</strong>es and grey bars show <str<strong>on</strong>g>the</str<strong>on</strong>g> fracti<strong>on</strong> <str<strong>on</strong>g>of</str<strong>on</strong>g> <str<strong>on</strong>g>the</str<strong>on</strong>g> budget applied to removal <str<strong>on</strong>g>of</str<strong>on</strong>g> meadows. Thebottom left graph shows area occupied by cl<strong>on</strong>es and meadows as c<strong>on</strong>trol strategy is implemented. B. The top right graph shows <str<strong>on</strong>g>the</str<strong>on</strong>g> optimal strategy (“meadowfirst”) for eradicati<strong>on</strong> <str<strong>on</strong>g>of</str<strong>on</strong>g> a 40 year old invasi<strong>on</strong> when 5000 m 2 can be removed per year for up to ten years. As in A, white bars show removal <str<strong>on</strong>g>of</str<strong>on</strong>g> cl<strong>on</strong>es and greybars show removal <str<strong>on</strong>g>of</str<strong>on</strong>g> meadows. The bottom right graph shows area occupied by cl<strong>on</strong>es and meadows as this c<strong>on</strong>trol strategy is implemented. Details <str<strong>on</strong>g>of</str<strong>on</strong>g> <str<strong>on</strong>g>the</str<strong>on</strong>g> optimizati<strong>on</strong>are given in text and in Taylor and Hastings (2004).- 123 -
Chapter 2: Spartina Distributi<strong>on</strong> and Spread<str<strong>on</strong>g>Proceedings</str<strong>on</strong>g> <str<strong>on</strong>g>of</str<strong>on</strong>g> <str<strong>on</strong>g>the</str<strong>on</strong>g> <str<strong>on</strong>g>Third</str<strong>on</strong>g> <str<strong>on</strong>g>Internati<strong>on</strong>al</str<strong>on</strong>g> <str<strong>on</strong>g>C<strong>on</strong>ference</str<strong>on</strong>g> <strong>on</strong> <strong>Invasive</strong> Spartinabudget is lower than is necessary to eradicate <str<strong>on</strong>g>the</str<strong>on</strong>g> invasi<strong>on</strong>, <str<strong>on</strong>g>the</str<strong>on</strong>g>optimizati<strong>on</strong> algorithm is unable to find a strategy thatremoves all <str<strong>on</strong>g>the</str<strong>on</strong>g> Spartina but instead finds <str<strong>on</strong>g>the</str<strong>on</strong>g> strategy thatminimizes <str<strong>on</strong>g>the</str<strong>on</strong>g> area occupied at <str<strong>on</strong>g>the</str<strong>on</strong>g> end <str<strong>on</strong>g>of</str<strong>on</strong>g> <str<strong>on</strong>g>the</str<strong>on</strong>g> c<strong>on</strong>trol period.We calculated <str<strong>on</strong>g>the</str<strong>on</strong>g> minimum annual budget in terms <str<strong>on</strong>g>of</str<strong>on</strong>g>area removed that is necessary to eradicate an invasi<strong>on</strong> withinten years when starting c<strong>on</strong>trol after 40 to 100 years <str<strong>on</strong>g>of</str<strong>on</strong>g>unchecked invasi<strong>on</strong>. The results are shown in Fig. 2. Thenecessary annual budget depends <strong>on</strong> <str<strong>on</strong>g>the</str<strong>on</strong>g> starting time and size<str<strong>on</strong>g>of</str<strong>on</strong>g> <str<strong>on</strong>g>the</str<strong>on</strong>g> invasi<strong>on</strong> but roughly speaking it is necessary to removeannually at least <str<strong>on</strong>g>the</str<strong>on</strong>g> equivalent <str<strong>on</strong>g>of</str<strong>on</strong>g> about 15 to 20% <str<strong>on</strong>g>of</str<strong>on</strong>g> <str<strong>on</strong>g>the</str<strong>on</strong>g>starting area <str<strong>on</strong>g>of</str<strong>on</strong>g> <str<strong>on</strong>g>the</str<strong>on</strong>g> invasi<strong>on</strong>.We found that <str<strong>on</strong>g>the</str<strong>on</strong>g> optimal allocati<strong>on</strong> <str<strong>on</strong>g>of</str<strong>on</strong>g> resources(removal <str<strong>on</strong>g>of</str<strong>on</strong>g> cl<strong>on</strong>es versus meadows) depends <strong>on</strong> <str<strong>on</strong>g>the</str<strong>on</strong>g> annualbudget level (Fig. 3). For a 40 year old invasi<strong>on</strong> that occupies~17,000 m 2 , if <str<strong>on</strong>g>the</str<strong>on</strong>g> budget is low (in this case removing at most3600m 2 per year; an area equivalent to about 22% <str<strong>on</strong>g>of</str<strong>on</strong>g> <str<strong>on</strong>g>the</str<strong>on</strong>g> initialinvasi<strong>on</strong>), <str<strong>on</strong>g>the</str<strong>on</strong>g> optimal strategy is to remove cl<strong>on</strong>es firstallowing <str<strong>on</strong>g>the</str<strong>on</strong>g> meadows to initially expand and <str<strong>on</strong>g>the</str<strong>on</strong>g>n removemeadows <strong>on</strong>ce <str<strong>on</strong>g>the</str<strong>on</strong>g> cl<strong>on</strong>es are largely removed. If <str<strong>on</strong>g>the</str<strong>on</strong>g> budget ishigh (removing at most 5000 m 2 per year; an area equivalent to30% <str<strong>on</strong>g>of</str<strong>on</strong>g> <str<strong>on</strong>g>the</str<strong>on</strong>g> initial invasi<strong>on</strong>), <str<strong>on</strong>g>the</str<strong>on</strong>g> optimal strategy is to remove<str<strong>on</strong>g>the</str<strong>on</strong>g> meadows first, allowing <str<strong>on</strong>g>the</str<strong>on</strong>g> cl<strong>on</strong>es to expand and startremoving cl<strong>on</strong>es in a later year. We also found that <str<strong>on</strong>g>the</str<strong>on</strong>g> cl<strong>on</strong>efirststrategy is optimal when minimizing cost <strong>on</strong>ly andignoring <str<strong>on</strong>g>the</str<strong>on</strong>g> risk posed by escaping seeds and that <str<strong>on</strong>g>the</str<strong>on</strong>g> cl<strong>on</strong>efirststrategy is <str<strong>on</strong>g>the</str<strong>on</strong>g> <strong>on</strong>ly possible way to eradicate an invasi<strong>on</strong>when <str<strong>on</strong>g>the</str<strong>on</strong>g> budget is low. The meadow-first strategy can <strong>on</strong>ly beused when <str<strong>on</strong>g>the</str<strong>on</strong>g> budget is high and it is optimal because itsubstantially reduces <str<strong>on</strong>g>the</str<strong>on</strong>g> risk <str<strong>on</strong>g>of</str<strong>on</strong>g> escaping seed although it doesnot substantially reduce <str<strong>on</strong>g>the</str<strong>on</strong>g> cost. We also found that <str<strong>on</strong>g>the</str<strong>on</strong>g> cl<strong>on</strong>efirststrategy is optimal when <str<strong>on</strong>g>the</str<strong>on</strong>g>re is no Allee effect since; inthis case, <str<strong>on</strong>g>the</str<strong>on</strong>g> cl<strong>on</strong>es produce as much seed as <str<strong>on</strong>g>the</str<strong>on</strong>g> meadows butgrow faster vegetatively (Taylor and Hastings 2004).CONCLUSIONSWe c<strong>on</strong>clude that <str<strong>on</strong>g>the</str<strong>on</strong>g> Allee effect caused by pollenlimitati<strong>on</strong> has dramatically slowed down <str<strong>on</strong>g>the</str<strong>on</strong>g> spread <str<strong>on</strong>g>of</str<strong>on</strong>g> thisplant and affects <str<strong>on</strong>g>the</str<strong>on</strong>g> optimal eradicati<strong>on</strong> strategy. The optimalc<strong>on</strong>trol strategy illustrates <str<strong>on</strong>g>the</str<strong>on</strong>g> importance <str<strong>on</strong>g>of</str<strong>on</strong>g> vegetative spreadin this plant. To c<strong>on</strong>trol an invasi<strong>on</strong> with limited or uncertainresources, <str<strong>on</strong>g>the</str<strong>on</strong>g> best and <strong>on</strong>ly viable strategy is to prioritize <str<strong>on</strong>g>the</str<strong>on</strong>g>removal <str<strong>on</strong>g>of</str<strong>on</strong>g> <str<strong>on</strong>g>the</str<strong>on</strong>g> fast growing, low density cl<strong>on</strong>es even though<str<strong>on</strong>g>the</str<strong>on</strong>g>y produce very few <str<strong>on</strong>g>of</str<strong>on</strong>g> <str<strong>on</strong>g>the</str<strong>on</strong>g> new seedlings. With higherbudgets and taking into account <str<strong>on</strong>g>the</str<strong>on</strong>g> risk <str<strong>on</strong>g>of</str<strong>on</strong>g> seed escaping tocol<strong>on</strong>ize o<str<strong>on</strong>g>the</str<strong>on</strong>g>r sites, <str<strong>on</strong>g>the</str<strong>on</strong>g> optimal strategy is to prioritizeremoval <str<strong>on</strong>g>of</str<strong>on</strong>g> <str<strong>on</strong>g>the</str<strong>on</strong>g> slower-growing, high density meadows.ACKNOWLEDGMENTSWe would like to thank D<strong>on</strong> Str<strong>on</strong>g, Debra Ayres,Miranda Wecker and John Lambrinos for helpful discussi<strong>on</strong>s.Field work was assisted by Washingt<strong>on</strong> State Department <str<strong>on</strong>g>of</str<strong>on</strong>g>Natural Resources and Washingt<strong>on</strong> State Fish and WildlifeService. This work was funded by <str<strong>on</strong>g>the</str<strong>on</strong>g> Nati<strong>on</strong>al ScienceFoundati<strong>on</strong> Biocomplexity Grant #DEB0083583 (P.I. AlanHastings)REFERENCESCiville, J.C. 2005. Spatial and temporal analyses <str<strong>on</strong>g>of</str<strong>on</strong>g> an estuarineinvasi<strong>on</strong>: Spartina alterniflora in Willapa Bay, WA. DoctoralDissertati<strong>on</strong>. University <str<strong>on</strong>g>of</str<strong>on</strong>g> California at Davis, Davis, CA.Davis, H.G., C.M. Taylor, J.C. Civille, and D. R. Str<strong>on</strong>g. 2004a. AnAllee effect at <str<strong>on</strong>g>the</str<strong>on</strong>g> fr<strong>on</strong>t <str<strong>on</strong>g>of</str<strong>on</strong>g> a plant invasi<strong>on</strong>: Spartina in a Pacificestuary. Journal <str<strong>on</strong>g>of</str<strong>on</strong>g> Ecology 92:321-327.Davis, H.G., C.M. Taylor, J.G. Lambrinos, and D.R. Str<strong>on</strong>g. 2004b.Pollen limitati<strong>on</strong> causes an Allee effect in a wind-pollinatedinvasive grass (Spartina alterniflora). PNAS 101:13804-13807.Lewis, M.A., and P. Kareiva. 1993. Allee dynamics and <str<strong>on</strong>g>the</str<strong>on</strong>g> spread <str<strong>on</strong>g>of</str<strong>on</strong>g>invading organisms. Theoretical Populati<strong>on</strong> Biology 43:141-158.Murphy, K C. 2003. Report to <str<strong>on</strong>g>the</str<strong>on</strong>g> Legislature: Progress <str<strong>on</strong>g>of</str<strong>on</strong>g> <str<strong>on</strong>g>the</str<strong>on</strong>g> 2003Spartina eradicati<strong>on</strong> program. PUB 805-110 (N/1/04), Washingt<strong>on</strong>State Department <str<strong>on</strong>g>of</str<strong>on</strong>g> Agriculture, Olympia.Stephens, P.A., W.J. Su<str<strong>on</strong>g>the</str<strong>on</strong>g>rland, and R. P. Frecklet<strong>on</strong>. 1999. What is<str<strong>on</strong>g>the</str<strong>on</strong>g> Allee effect? Oikos 87:185-190.Taylor, C.M., H.G. Davis, J.C. Civille, FS. Grevstad, and A. Hastings.2004. C<strong>on</strong>sequences <str<strong>on</strong>g>of</str<strong>on</strong>g> an Allee effect <strong>on</strong> <str<strong>on</strong>g>the</str<strong>on</strong>g> invasi<strong>on</strong> <str<strong>on</strong>g>of</str<strong>on</strong>g> a Pacificestuary by Spartina alterniflora. Ecology 85:3254-3266.Taylor, C.M., and A. Hastings. 2004. Finding optimal c<strong>on</strong>trolstrategies for invasive species: a density-structured model forSpartina alterniflora. Journal <str<strong>on</strong>g>of</str<strong>on</strong>g> Applied Ecology 41:1049-1057.Wang, M.H., and M. Kot. 2001. Speeds <str<strong>on</strong>g>of</str<strong>on</strong>g> invasi<strong>on</strong> in a model withstr<strong>on</strong>g or weak Allee effects. Ma<str<strong>on</strong>g>the</str<strong>on</strong>g>matical Biosciences 171:83-97.Wang, M.H., M. Kot, and M.G. Neubert. 2002. Integrodifferenceequati<strong>on</strong>s, Allee effects, and invasi<strong>on</strong>s. Journal <str<strong>on</strong>g>of</str<strong>on</strong>g> Ma<str<strong>on</strong>g>the</str<strong>on</strong>g>maticalBiology 44:150-168.- 124 -


