Proceedings of the Third International Conference on Invasive ...
Proceedings of the Third International Conference on Invasive ...
Proceedings of the Third International Conference on Invasive ...
- No tags were found...

Create successful ePaper yourself
Turn your PDF publications into a flip-book with our unique Google optimized e-Paper software.
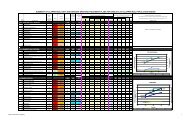
Chapter 4: Spartina C<strong>on</strong>trol and Management<str<strong>on</strong>g>Proceedings</str<strong>on</strong>g> <str<strong>on</strong>g>of</str<strong>on</strong>g> <str<strong>on</strong>g>the</str<strong>on</strong>g> <str<strong>on</strong>g>Third</str<strong>on</strong>g> <str<strong>on</strong>g>Internati<strong>on</strong>al</str<strong>on</strong>g> <str<strong>on</strong>g>C<strong>on</strong>ference</str<strong>on</strong>g> <strong>on</strong> <strong>Invasive</strong> Spartinaei<str<strong>on</strong>g>the</str<strong>on</strong>g>r brachypterous (rudimentary or abnormally small) ormacropterous (l<strong>on</strong>g or large).We found striking differences am<strong>on</strong>g <str<strong>on</strong>g>the</str<strong>on</strong>g> fourpopulati<strong>on</strong>s in <str<strong>on</strong>g>the</str<strong>on</strong>g> densities attained by <str<strong>on</strong>g>the</str<strong>on</strong>g> end <str<strong>on</strong>g>of</str<strong>on</strong>g> summer(Fig. 1A; ANOVA F=9.227, P=0.002). The best performinggeographic source, in terms <str<strong>on</strong>g>of</str<strong>on</strong>g> <str<strong>on</strong>g>the</str<strong>on</strong>g> densities <str<strong>on</strong>g>of</str<strong>on</strong>g> P. marginataobtained by end <str<strong>on</strong>g>of</str<strong>on</strong>g> summer, was Rhode Island, which is also<str<strong>on</strong>g>the</str<strong>on</strong>g> locati<strong>on</strong> with <str<strong>on</strong>g>the</str<strong>on</strong>g> best summer temperature match toWillapa Bay. In post-hoc tests, Rhode Island populati<strong>on</strong>ssignificantly differed from Georgia and Virginia, but did notsignificantly differ from California. California did notsignificantly differ from Georgia and Virginia.The populati<strong>on</strong>s also differed in <str<strong>on</strong>g>the</str<strong>on</strong>g> proporti<strong>on</strong> <str<strong>on</strong>g>of</str<strong>on</strong>g> <str<strong>on</strong>g>the</str<strong>on</strong>g>populati<strong>on</strong> that was in <str<strong>on</strong>g>the</str<strong>on</strong>g> adult stage at <str<strong>on</strong>g>the</str<strong>on</strong>g> end <str<strong>on</strong>g>of</str<strong>on</strong>g>September (Fig. 1B; ANOVA F=3.637, P=0.030). Californiapopulati<strong>on</strong>s had four to five times <str<strong>on</strong>g>the</str<strong>on</strong>g> proporti<strong>on</strong> <str<strong>on</strong>g>of</str<strong>on</strong>g> adultsfound in <str<strong>on</strong>g>the</str<strong>on</strong>g> o<str<strong>on</strong>g>the</str<strong>on</strong>g>r populati<strong>on</strong>s. This may indicate differencesin phenology although fur<str<strong>on</strong>g>the</str<strong>on</strong>g>r data is needed.Finally, we found differences am<strong>on</strong>g <str<strong>on</strong>g>the</str<strong>on</strong>g> fourpopulati<strong>on</strong>s in <str<strong>on</strong>g>the</str<strong>on</strong>g> proporti<strong>on</strong> <str<strong>on</strong>g>of</str<strong>on</strong>g> individuals that weremacropterous (Fig. 4C; ANOVA F=8.71, P