Proceedings of the Third International Conference on Invasive ...
Proceedings of the Third International Conference on Invasive ...
Proceedings of the Third International Conference on Invasive ...
- No tags were found...

Create successful ePaper yourself
Turn your PDF publications into a flip-book with our unique Google optimized e-Paper software.
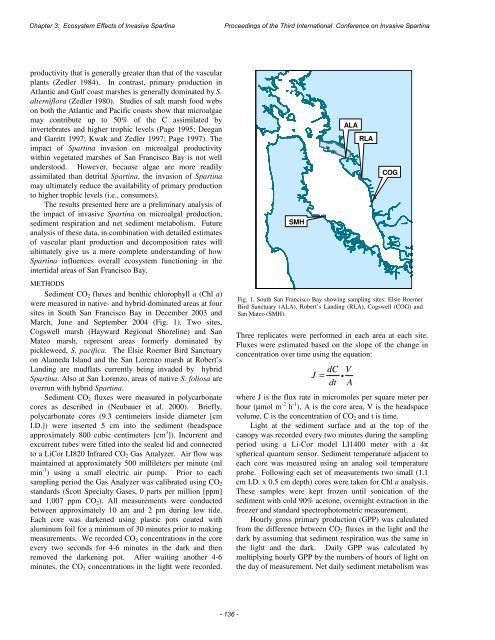
Chapter 3: Ecosystem Effects <str<strong>on</strong>g>of</str<strong>on</strong>g> <strong>Invasive</strong> Spartina<str<strong>on</strong>g>Proceedings</str<strong>on</strong>g> <str<strong>on</strong>g>of</str<strong>on</strong>g> <str<strong>on</strong>g>the</str<strong>on</strong>g> <str<strong>on</strong>g>Third</str<strong>on</strong>g> <str<strong>on</strong>g>Internati<strong>on</strong>al</str<strong>on</strong>g> <str<strong>on</strong>g>C<strong>on</strong>ference</str<strong>on</strong>g> <strong>on</strong> <strong>Invasive</strong> Spartinaproductivity that is generally greater than that <str<strong>on</strong>g>of</str<strong>on</strong>g> <str<strong>on</strong>g>the</str<strong>on</strong>g> vascularplants (Zedler 1984). In c<strong>on</strong>trast, primary producti<strong>on</strong> inAtlantic and Gulf coast marshes is generally dominated by S.alterniflora (Zedler 1980). Studies <str<strong>on</strong>g>of</str<strong>on</strong>g> salt marsh food webs<strong>on</strong> both <str<strong>on</strong>g>the</str<strong>on</strong>g> Atlantic and Pacific coasts show that microalgaemay c<strong>on</strong>tribute up to 50% <str<strong>on</strong>g>of</str<strong>on</strong>g> <str<strong>on</strong>g>the</str<strong>on</strong>g> C assimilated byinvertebrates and higher trophic levels (Page 1995; Deeganand Garritt 1997; Kwak and Zedler 1997; Page 1997). Theimpact <str<strong>on</strong>g>of</str<strong>on</strong>g> Spartina invasi<strong>on</strong> <strong>on</strong> microalgal productivitywithin vegetated marshes <str<strong>on</strong>g>of</str<strong>on</strong>g> San Francisco Bay is not wellunderstood. However, because algae are more readilyassimilated than detrital Spartina, <str<strong>on</strong>g>the</str<strong>on</strong>g> invasi<strong>on</strong> <str<strong>on</strong>g>of</str<strong>on</strong>g> Spartinamay ultimately reduce <str<strong>on</strong>g>the</str<strong>on</strong>g> availability <str<strong>on</strong>g>of</str<strong>on</strong>g> primary producti<strong>on</strong>to higher trophic levels (i.e., c<strong>on</strong>sumers).The results presented here are a preliminary analysis <str<strong>on</strong>g>of</str<strong>on</strong>g><str<strong>on</strong>g>the</str<strong>on</strong>g> impact <str<strong>on</strong>g>of</str<strong>on</strong>g> invasive Spartina <strong>on</strong> microalgal producti<strong>on</strong>,sediment respirati<strong>on</strong> and net sediment metabolism. Futureanalysis <str<strong>on</strong>g>of</str<strong>on</strong>g> <str<strong>on</strong>g>the</str<strong>on</strong>g>se data, in combinati<strong>on</strong> with detailed estimates<str<strong>on</strong>g>of</str<strong>on</strong>g> vascular plant producti<strong>on</strong> and decompositi<strong>on</strong> rates willultimately give us a more complete understanding <str<strong>on</strong>g>of</str<strong>on</strong>g> howSpartina influences overall ecosystem functi<strong>on</strong>ing in <str<strong>on</strong>g>the</str<strong>on</strong>g>intertidal areas <str<strong>on</strong>g>of</str<strong>on</strong>g> San Francisco Bay.METHODSSediment CO 2 fluxes and benthic chlorophyll a (Chl a)were measured in native- and hybrid-dominated areas at foursites in South San Francisco Bay in December 2003 andMarch, June and September 2004 (Fig. 1). Two sites,Cogswell marsh (Hayward Regi<strong>on</strong>al Shoreline) and SanMateo marsh, represent areas formerly dominated bypickleweed, S. pacifica. The Elsie Roemer Bird Sanctuary<strong>on</strong> Alameda Island and <str<strong>on</strong>g>the</str<strong>on</strong>g> San Lorenzo marsh at Robert’sLanding are mudflats currently being invaded by hybridSpartina. Also at San Lorenzo, areas <str<strong>on</strong>g>of</str<strong>on</strong>g> native S. foliosa areoverrun with hybrid Spartina.Sediment CO 2 fluxes were measured in polycarb<strong>on</strong>atecores as described in (Neubauer et al. 2000). Briefly,polycarb<strong>on</strong>ate cores (9.3 centimeters inside diameter [cmI.D.]) were inserted 5 cm into <str<strong>on</strong>g>the</str<strong>on</strong>g> sediment (headspaceapproximately 800 cubic centimeters [cm 3 ]). Incurrent andexcurrent tubes were fitted into <str<strong>on</strong>g>the</str<strong>on</strong>g> sealed lid and c<strong>on</strong>nectedto a LiCor LI820 Infrared CO 2 Gas Analyzer. Air flow wasmaintained at approximately 500 millileters per minute (mlmin -1 ) using a small electric air pump. Prior to eachsampling period <str<strong>on</strong>g>the</str<strong>on</strong>g> Gas Analyzer was calibrated using CO 2standards (Scott Specialty Gases, 0 parts per milli<strong>on</strong> [ppm]and 1,007 ppm CO 2 ). All measurements were c<strong>on</strong>ductedbetween approximately 10 am and 2 pm during low tide.Each core was darkened using plastic pots coated withaluminum foil for a minimum <str<strong>on</strong>g>of</str<strong>on</strong>g> 30 minutes prior to makingmeasurements. We recorded CO 2 c<strong>on</strong>centrati<strong>on</strong>s in <str<strong>on</strong>g>the</str<strong>on</strong>g> coreevery two sec<strong>on</strong>ds for 4-6 minutes in <str<strong>on</strong>g>the</str<strong>on</strong>g> dark and <str<strong>on</strong>g>the</str<strong>on</strong>g>nremoved <str<strong>on</strong>g>the</str<strong>on</strong>g> darkening pot. After waiting ano<str<strong>on</strong>g>the</str<strong>on</strong>g>r 4-6minutes, <str<strong>on</strong>g>the</str<strong>on</strong>g> CO 2 c<strong>on</strong>centrati<strong>on</strong>s in <str<strong>on</strong>g>the</str<strong>on</strong>g> light were recorded.SBOSMHBAIALARLAOLACOGALCFig. 1. South San Francisco Bay showing sampling sites: Elsie RoemerBird Sanctuary (ALA), Robert’s Landing (RLA), Cogswell (COG) andSan Mateo (SMH).Three replicates were performed in each area at each site.Fluxes were estimated based <strong>on</strong> <str<strong>on</strong>g>the</str<strong>on</strong>g> slope <str<strong>on</strong>g>of</str<strong>on</strong>g> <str<strong>on</strong>g>the</str<strong>on</strong>g> change inc<strong>on</strong>centrati<strong>on</strong> over time using <str<strong>on</strong>g>the</str<strong>on</strong>g> equati<strong>on</strong>:dC VJ = •dt Awhere J is <str<strong>on</strong>g>the</str<strong>on</strong>g> flux rate in micromoles per square meter perhour (μmol m -2 h -1 ), A is <str<strong>on</strong>g>the</str<strong>on</strong>g> core area, V is <str<strong>on</strong>g>the</str<strong>on</strong>g> headspacevolume, C is <str<strong>on</strong>g>the</str<strong>on</strong>g> c<strong>on</strong>centrati<strong>on</strong> <str<strong>on</strong>g>of</str<strong>on</strong>g> CO 2 and t is time.Light at <str<strong>on</strong>g>the</str<strong>on</strong>g> sediment surface and at <str<strong>on</strong>g>the</str<strong>on</strong>g> top <str<strong>on</strong>g>of</str<strong>on</strong>g> <str<strong>on</strong>g>the</str<strong>on</strong>g>canopy was recorded every two minutes during <str<strong>on</strong>g>the</str<strong>on</strong>g> samplingperiod using a Li-Cor model LI1400 meter with a 4πspherical quantum sensor. Sediment temperature adjacent toeach core was measured using an analog soil temperatureprobe. Following each set <str<strong>on</strong>g>of</str<strong>on</strong>g> measurements two small (1.1cm I.D. x 0.5 cm depth) cores were taken for Chl a analysis.These samples were kept frozen until s<strong>on</strong>icati<strong>on</strong> <str<strong>on</strong>g>of</str<strong>on</strong>g> <str<strong>on</strong>g>the</str<strong>on</strong>g>sediment with cold 90% acet<strong>on</strong>e, overnight extracti<strong>on</strong> in <str<strong>on</strong>g>the</str<strong>on</strong>g>freezer and standard spectrophotometric measurement.Hourly gross primary producti<strong>on</strong> (GPP) was calculatedfrom <str<strong>on</strong>g>the</str<strong>on</strong>g> difference between CO 2 fluxes in <str<strong>on</strong>g>the</str<strong>on</strong>g> light and <str<strong>on</strong>g>the</str<strong>on</strong>g>dark by assuming that sediment respirati<strong>on</strong> was <str<strong>on</strong>g>the</str<strong>on</strong>g> same in<str<strong>on</strong>g>the</str<strong>on</strong>g> light and <str<strong>on</strong>g>the</str<strong>on</strong>g> dark. Daily GPP was calculated bymultiplying hourly GPP by <str<strong>on</strong>g>the</str<strong>on</strong>g> numbers <str<strong>on</strong>g>of</str<strong>on</strong>g> hours <str<strong>on</strong>g>of</str<strong>on</strong>g> light <strong>on</strong><str<strong>on</strong>g>the</str<strong>on</strong>g> day <str<strong>on</strong>g>of</str<strong>on</strong>g> measurement. Net daily sediment metabolism was- 136 -