<str<strong>on</strong>g>Proceedings</str<strong>on</strong>g> <str<strong>on</strong>g>of</str<strong>on</strong>g> <str<strong>on</strong>g>the</str<strong>on</strong>g> <str<strong>on</strong>g>Third</str<strong>on</strong>g> <str<strong>on</strong>g>Internati<strong>on</strong>al</str<strong>on</strong>g> <str<strong>on</strong>g>C<strong>on</strong>ference</str<strong>on</strong>g> <strong>on</strong> <strong>Invasive</strong> SpartinaChapter 2: Spartina Distributi<strong>on</strong> and SpreadTable 2. Change in area covered by n<strong>on</strong>-native Spartina species between2001 and 2003 averaged over all sites surveyed, comparing aerial photointerpretati<strong>on</strong> measurements (APIM) with field measurements and fieldestimates.SpeciesS. AlternifloraHybridsAverage Site Change in Area from 2001-2003Field Measurement +Field Estimates(N=28)**APIM(N=5)*317.00% 213.05%S. densiflora 52.83% n/aS. patens -84.2% n/aAll Species 244.41% 213.1%* Five <str<strong>on</strong>g>of</str<strong>on</strong>g> <str<strong>on</strong>g>the</str<strong>on</strong>g> 28 sites had <strong>on</strong>ly aerial photo interpretati<strong>on</strong> measurementsfor 2001. For <str<strong>on</strong>g>the</str<strong>on</strong>g>se five sites, a 2001 field estimate was calculated using aregressi<strong>on</strong> curve based <strong>on</strong> a correlati<strong>on</strong> between <str<strong>on</strong>g>the</str<strong>on</strong>g> existing 2001 and2003 field measurements. This 2001 field estimate was used in <str<strong>on</strong>g>the</str<strong>on</strong>g> place<str<strong>on</strong>g>of</str<strong>on</strong>g> <str<strong>on</strong>g>the</str<strong>on</strong>g> 2001 field survey data to calculate <str<strong>on</strong>g>the</str<strong>on</strong>g> change in area from 2001-2003.** For five sites <str<strong>on</strong>g>of</str<strong>on</strong>g> <str<strong>on</strong>g>the</str<strong>on</strong>g> 28 sites, 2001 aerial photo interpretati<strong>on</strong> measurementwas used in <str<strong>on</strong>g>the</str<strong>on</strong>g> place <str<strong>on</strong>g>of</str<strong>on</strong>g> <str<strong>on</strong>g>the</str<strong>on</strong>g> 2001 field survey data to calculate<str<strong>on</strong>g>the</str<strong>on</strong>g> change in area from 2001-2003.Data AnalysesData were subjected to a variety <str<strong>on</strong>g>of</str<strong>on</strong>g> quality assurancemethods (Zaremba et al. 2004). Cross-tabulati<strong>on</strong> <str<strong>on</strong>g>of</str<strong>on</strong>g>categorical names was d<strong>on</strong>e to check for typographicalerrors and duplicati<strong>on</strong>s. Summary statistics were <str<strong>on</strong>g>the</str<strong>on</strong>g>ncalculated for quantitative variables to check forunreas<strong>on</strong>able ranges and outliers. Descriptive statistics werecalculated and raw data transformed as needed to meetrequirements <str<strong>on</strong>g>of</str<strong>on</strong>g> parametric statistical tests.We tested <str<strong>on</strong>g>the</str<strong>on</strong>g> hypo<str<strong>on</strong>g>the</str<strong>on</strong>g>sis that <str<strong>on</strong>g>the</str<strong>on</strong>g>re was an increase inarea covered by n<strong>on</strong>-native Spartina using a t-test betweenarea covered in 2001 and 2003. The hypo<str<strong>on</strong>g>the</str<strong>on</strong>g>sis that aparticular species, site type or bay regi<strong>on</strong> (latitude) had aninfluence <strong>on</strong> <str<strong>on</strong>g>the</str<strong>on</strong>g> change in area covered between 2001 and2003 was tested with an Analysis <str<strong>on</strong>g>of</str<strong>on</strong>g> Variance (ANOVA).We tested <str<strong>on</strong>g>the</str<strong>on</strong>g> hypo<str<strong>on</strong>g>the</str<strong>on</strong>g>sis that site latitude had a significanteffect <strong>on</strong> change in area covered between 2001 and 2003 byusing an Analysis <str<strong>on</strong>g>of</str<strong>on</strong>g> Covariance (ANCOVA). The accuracy<str<strong>on</strong>g>of</str<strong>on</strong>g> field identificati<strong>on</strong> <str<strong>on</strong>g>of</str<strong>on</strong>g> S. alterniflora, S. foliosa and <str<strong>on</strong>g>the</str<strong>on</strong>g>irhybrids was tested statistically with a Chi-square test <str<strong>on</strong>g>of</str<strong>on</strong>g>frequencies <str<strong>on</strong>g>of</str<strong>on</strong>g> correct field identificati<strong>on</strong> <str<strong>on</strong>g>of</str<strong>on</strong>g> S. alterniflora,S. alterniflora hybrids, and S. foliosa. This test used <str<strong>on</strong>g>the</str<strong>on</strong>g>genetic analysis as <str<strong>on</strong>g>the</str<strong>on</strong>g> true (or <str<strong>on</strong>g>the</str<strong>on</strong>g>oretically expected)frequencies and <str<strong>on</strong>g>the</str<strong>on</strong>g> field observati<strong>on</strong>s as <str<strong>on</strong>g>the</str<strong>on</strong>g> observedfrequencies.Based <strong>on</strong> data averaged over all species and all sitessampled, <str<strong>on</strong>g>the</str<strong>on</strong>g> n<strong>on</strong>-native species and hybrids <str<strong>on</strong>g>of</str<strong>on</strong>g> Spartinaincreased 244% in area covered (paired sample t-test, p =0.003) between 2001 and 2003 (Table 2). Field surveys(field measurement plus estimates) showed an increase <str<strong>on</strong>g>of</str<strong>on</strong>g>n<strong>on</strong>-native Spartina <str<strong>on</strong>g>of</str<strong>on</strong>g> 15% in <str<strong>on</strong>g>the</str<strong>on</strong>g> North Bay, 292% in <str<strong>on</strong>g>the</str<strong>on</strong>g>Central Bay and 177% in <str<strong>on</strong>g>the</str<strong>on</strong>g> South Bay from 2001 to 2003.These measurements showed that n<strong>on</strong>-native Spartina (allspecies) increased from 2001-2003 by 172% at Type I sites(tidal, micro-tidal, and formerly diked bayland, and backbarrier marsh), by 504% at Type II sites (fringing tidalmarsh, mud flats and estuarine beaches), by 108% at TypeIII sites (major tidal sloughs, creeks or flood c<strong>on</strong>trolchannels), and by 169% at Type IV sites (urbanized rock,riprap, dock, ramp, marina).S. patens occurred at <strong>on</strong>ly <strong>on</strong>e site in <str<strong>on</strong>g>the</str<strong>on</strong>g> North Bay, aSite Type I. It decreased in area covered by 84%.S. densiflora decreased in nearly as many sites (3) as itincreased (4). Statistical tests were precluded for S.densiflora because <str<strong>on</strong>g>of</str<strong>on</strong>g> low sample sizes but <str<strong>on</strong>g>the</str<strong>on</strong>g> averagepercent change in area covered was 53% with a range from-94% to +219%. Spartina densiflora was mapped at <strong>on</strong>ly<strong>on</strong>e sample locati<strong>on</strong> in <str<strong>on</strong>g>the</str<strong>on</strong>g> North Bay (Pt. Pinole), where itincreased by 114%. Spartina densiflora increased by 43% in<str<strong>on</strong>g>the</str<strong>on</strong>g> Central Bay. Spartina densiflora increased in Type I andType III sites but apparently decreased slightly at Type IIsites. No S. densiflora were noted at Type IV sites.Hybrids make up most <str<strong>on</strong>g>of</str<strong>on</strong>g> <str<strong>on</strong>g>the</str<strong>on</strong>g> n<strong>on</strong>-native coverage and<str<strong>on</strong>g>the</str<strong>on</strong>g>ir proporti<strong>on</strong> am<strong>on</strong>g <str<strong>on</strong>g>the</str<strong>on</strong>g> n<strong>on</strong>-natives increased in 2003compared to 2001 accounting for 83% <str<strong>on</strong>g>of</str<strong>on</strong>g> <str<strong>on</strong>g>the</str<strong>on</strong>g> n<strong>on</strong>-nativecoverage in 2001 and increasing to 90% <str<strong>on</strong>g>of</str<strong>on</strong>g> n<strong>on</strong>-nativecordgrasses in 2003. Hybrids increased in cover three-foldbetween 2001 and 2003 (paired sample t-test, p < 0.001)with a range from -90% to +2175% depending <strong>on</strong> site.Hybrids increased in area covered in 19 <str<strong>on</strong>g>of</str<strong>on</strong>g> 23 marshessampled, a statistically significant proporti<strong>on</strong> <str<strong>on</strong>g>of</str<strong>on</strong>g> <str<strong>on</strong>g>the</str<strong>on</strong>g> sites(n<strong>on</strong>-parametric sign test, p = 0.003).Hybrids in <str<strong>on</strong>g>the</str<strong>on</strong>g> South Bay were resp<strong>on</strong>sible for <str<strong>on</strong>g>the</str<strong>on</strong>g> 177%increase in n<strong>on</strong>-native invasive Spartina between 2001-2003. Hybrids increased by 403% in <str<strong>on</strong>g>the</str<strong>on</strong>g> Central Bay.Hybrids were not found in any sample sites <str<strong>on</strong>g>of</str<strong>on</strong>g> <str<strong>on</strong>g>the</str<strong>on</strong>g> NorthBay. Hybrids had higher mean and total area covered in <str<strong>on</strong>g>the</str<strong>on</strong>g>Central Bay than in <str<strong>on</strong>g>the</str<strong>on</strong>g> South Bay in both 2001 and 2003.The slight trend <str<strong>on</strong>g>of</str<strong>on</strong>g> percent change in hybrid area coveredwith latitude (south-to-north trend) was not statisticallysignificant (p = 0.18).While hybrid acreage increased greatly from 2001 to2003 across all site types, site types I and II had higherpercent increases, <strong>on</strong> average, than site types III and IV(n<strong>on</strong>-parametric sign test; p = 0.254). Analysis <str<strong>on</strong>g>of</str<strong>on</strong>g> <str<strong>on</strong>g>the</str<strong>on</strong>g> areacovered by hybrids (log-transformed square meters) in 2003found no statistical difference am<strong>on</strong>g site types (ANOVA,p = 0.377).Aerial Photos versus Field MeasurementsThe estimates <str<strong>on</strong>g>of</str<strong>on</strong>g> <str<strong>on</strong>g>the</str<strong>on</strong>g> area covered by n<strong>on</strong>-nativeSpartina hybrids differed between <str<strong>on</strong>g>the</str<strong>on</strong>g> aerial photo-77-
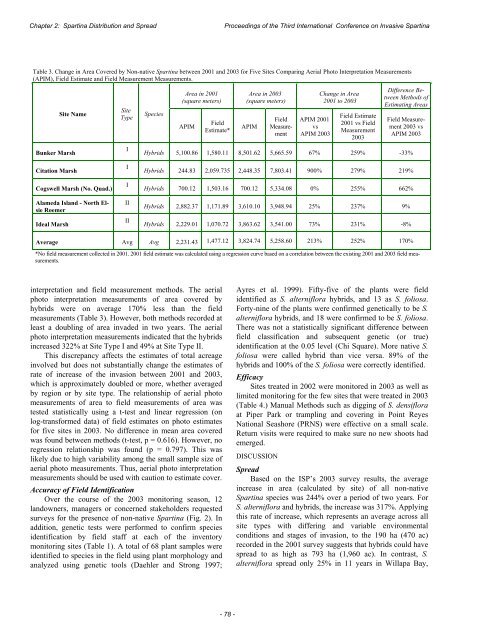
Chapter 2: Spartina Distributi<strong>on</strong> and Spread<str<strong>on</strong>g>Proceedings</str<strong>on</strong>g> <str<strong>on</strong>g>of</str<strong>on</strong>g> <str<strong>on</strong>g>the</str<strong>on</strong>g> <str<strong>on</strong>g>Third</str<strong>on</strong>g> <str<strong>on</strong>g>Internati<strong>on</strong>al</str<strong>on</strong>g> <str<strong>on</strong>g>C<strong>on</strong>ference</str<strong>on</strong>g> <strong>on</strong> <strong>Invasive</strong> SpartinaTable 3. Change in Area Covered by N<strong>on</strong>-native Spartina between 2001 and 2003 for Five Sites Comparing Aerial Photo Interpretati<strong>on</strong> Measurements(APIM), Field Estimate and Field Measurement Measurements.Site NameBunker MarshSiteTypeISpeciesArea in 2001(square meters)APIMFieldEstimate*Area in 2003(square meters)APIMFieldMeasurementAPIM 2001vsAPIM 2003Change in Area2001 to 2003Field Estimate2001 vs FieldMeasurement2003Difference BetweenMethods <str<strong>on</strong>g>of</str<strong>on</strong>g>Estimating AreasField Measurement2003 vsAPIM 2003Hybrids 5,100.86 1,580.11 8,501.62 5,665.59 67% 259% -33%Citati<strong>on</strong> MarshCogswell Marsh (No. Quad.)Alameda Island - North ElsieRoemerIdeal MarshIIIIIIHybrids 244.83 2,059.735 2,448.35 7,803.41 900% 279% 219%Hybrids 700.12 1,503.16 700.12 5,334.08 0% 255% 662%Hybrids 2,882.37 1,171.89 3,610.10 3,948.94 25% 237% 9%Hybrids 2,229.01 1,070.72 3,863.62 3,541.00 73% 231% -8%Average Avg Avg 2,231.43 1,477.12 3,824.74 5,258.60 213% 252% 170%interpretati<strong>on</strong> and field measurement methods. The aerialphoto interpretati<strong>on</strong> measurements <str<strong>on</strong>g>of</str<strong>on</strong>g> area covered byhybrids were <strong>on</strong> average 170% less than <str<strong>on</strong>g>the</str<strong>on</strong>g> fieldmeasurements (Table 3). However, both methods recorded atleast a doubling <str<strong>on</strong>g>of</str<strong>on</strong>g> area invaded in two years. The aerialphoto interpretati<strong>on</strong> measurements indicated that <str<strong>on</strong>g>the</str<strong>on</strong>g> hybridsincreased 322% at Site Type I and 49% at Site Type II.This discrepancy affects <str<strong>on</strong>g>the</str<strong>on</strong>g> estimates <str<strong>on</strong>g>of</str<strong>on</strong>g> total acreageinvolved but does not substantially change <str<strong>on</strong>g>the</str<strong>on</strong>g> estimates <str<strong>on</strong>g>of</str<strong>on</strong>g>rate <str<strong>on</strong>g>of</str<strong>on</strong>g> increase <str<strong>on</strong>g>of</str<strong>on</strong>g> <str<strong>on</strong>g>the</str<strong>on</strong>g> invasi<strong>on</strong> between 2001 and 2003,which is approximately doubled or more, whe<str<strong>on</strong>g>the</str<strong>on</strong>g>r averagedby regi<strong>on</strong> or by site type. The relati<strong>on</strong>ship <str<strong>on</strong>g>of</str<strong>on</strong>g> aerial photomeasurements <str<strong>on</strong>g>of</str<strong>on</strong>g> area to field measurements <str<strong>on</strong>g>of</str<strong>on</strong>g> area wastested statistically using a t-test and linear regressi<strong>on</strong> (<strong>on</strong>log-transformed data) <str<strong>on</strong>g>of</str<strong>on</strong>g> field estimates <strong>on</strong> photo estimatesfor five sites in 2003. No difference in mean area coveredwas found between methods (t-test, p = 0.616). However, noregressi<strong>on</strong> relati<strong>on</strong>ship was found (p = 0.797). This waslikely due to high variability am<strong>on</strong>g <str<strong>on</strong>g>the</str<strong>on</strong>g> small sample size <str<strong>on</strong>g>of</str<strong>on</strong>g>aerial photo measurements. Thus, aerial photo interpretati<strong>on</strong>measurements should be used with cauti<strong>on</strong> to estimate cover.Accuracy <str<strong>on</strong>g>of</str<strong>on</strong>g> Field Identificati<strong>on</strong>Over <str<strong>on</strong>g>the</str<strong>on</strong>g> course <str<strong>on</strong>g>of</str<strong>on</strong>g> <str<strong>on</strong>g>the</str<strong>on</strong>g> 2003 m<strong>on</strong>itoring seas<strong>on</strong>, 12landowners, managers or c<strong>on</strong>cerned stakeholders requestedsurveys for <str<strong>on</strong>g>the</str<strong>on</strong>g> presence <str<strong>on</strong>g>of</str<strong>on</strong>g> n<strong>on</strong>-native Spartina (Fig. 2). Inadditi<strong>on</strong>, genetic tests were performed to c<strong>on</strong>firm speciesidentificati<strong>on</strong> by field staff at each <str<strong>on</strong>g>of</str<strong>on</strong>g> <str<strong>on</strong>g>the</str<strong>on</strong>g> inventorym<strong>on</strong>itoring sites (Table 1). A total <str<strong>on</strong>g>of</str<strong>on</strong>g> 68 plant samples wereidentified to species in <str<strong>on</strong>g>the</str<strong>on</strong>g> field using plant morphology andanalyzed using genetic tools (Daehler and Str<strong>on</strong>g 1997;Ayres et al. 1999). Fifty-five <str<strong>on</strong>g>of</str<strong>on</strong>g> <str<strong>on</strong>g>the</str<strong>on</strong>g> plants were fieldidentified as S. alterniflora hybrids, and 13 as S. foliosa.Forty-nine <str<strong>on</strong>g>of</str<strong>on</strong>g> <str<strong>on</strong>g>the</str<strong>on</strong>g> plants were c<strong>on</strong>firmed genetically to be S.alterniflora hybrids, and 18 were c<strong>on</strong>firmed to be S. foliosa.There was not a statistically significant difference betweenfield classificati<strong>on</strong> and subsequent genetic (or true)identificati<strong>on</strong> at <str<strong>on</strong>g>the</str<strong>on</strong>g> 0.05 level (Chi Square). More native S.foliosa were called hybrid than vice versa. 89% <str<strong>on</strong>g>of</str<strong>on</strong>g> <str<strong>on</strong>g>the</str<strong>on</strong>g>hybrids and 100% <str<strong>on</strong>g>of</str<strong>on</strong>g> <str<strong>on</strong>g>the</str<strong>on</strong>g> S. foliosa were correctly identified.EfficacySites treated in 2002 were m<strong>on</strong>itored in 2003 as well aslimited m<strong>on</strong>itoring for <str<strong>on</strong>g>the</str<strong>on</strong>g> few sites that were treated in 2003(Table 4.) Manual Methods such as digging <str<strong>on</strong>g>of</str<strong>on</strong>g> S. densifloraat Piper Park or trampling and covering in Point ReyesNati<strong>on</strong>al Seashore (PRNS) were effective <strong>on</strong> a small scale.Return visits were required to make sure no new shoots hademerged.DISCUSSIONSpreadBased <strong>on</strong> <str<strong>on</strong>g>the</str<strong>on</strong>g> ISP’s 2003 survey results, <str<strong>on</strong>g>the</str<strong>on</strong>g> averageincrease in area (calculated by site) <str<strong>on</strong>g>of</str<strong>on</strong>g> all n<strong>on</strong>-nativeSpartina species was 244% over a period <str<strong>on</strong>g>of</str<strong>on</strong>g> two years. ForS. alterniflora and hybrids, <str<strong>on</strong>g>the</str<strong>on</strong>g> increase was 317%. Applyingthis rate <str<strong>on</strong>g>of</str<strong>on</strong>g> increase, which represents an average across allsite types with differing and variable envir<strong>on</strong>mentalc<strong>on</strong>diti<strong>on</strong>s and stages <str<strong>on</strong>g>of</str<strong>on</strong>g> invasi<strong>on</strong>, to <str<strong>on</strong>g>the</str<strong>on</strong>g> 190 ha (470 ac)recorded in <str<strong>on</strong>g>the</str<strong>on</strong>g> 2001 survey suggests that hybrids could havespread to as high as 793 ha (1,960 ac). In c<strong>on</strong>trast, S.alterniflora spread <strong>on</strong>ly 25% in 11 years in Willapa Bay,*No field measurement collected in 2001. 2001 field estimate was calculated using a regressi<strong>on</strong> curve based <strong>on</strong> a correlati<strong>on</strong> between <str<strong>on</strong>g>the</str<strong>on</strong>g> existing 2001 and 2003 field measurements.-78-