<str<strong>on</strong>g>Proceedings</str<strong>on</strong>g> <str<strong>on</strong>g>of</str<strong>on</strong>g> <str<strong>on</strong>g>the</str<strong>on</strong>g> <str<strong>on</strong>g>Third</str<strong>on</strong>g> <str<strong>on</strong>g>Internati<strong>on</strong>al</str<strong>on</strong>g> <str<strong>on</strong>g>C<strong>on</strong>ference</str<strong>on</strong>g> <strong>on</strong> <strong>Invasive</strong> SpartinaChapter 1: Spartina BiologyEFFECTS OF SALINITY ON PHOTOSYNTHESIS IN C 4 ESTUARINE GRASSESB.R. MARICLE 1,2 ,O.KIIRATS 1 ,R.W.LEE 1 , AND G.E. EDWARDS 11 School <str<strong>on</strong>g>of</str<strong>on</strong>g> Biological Sciences, Washingt<strong>on</strong> State University, Pullman, WA 99164-42362 Present address: Department <str<strong>on</strong>g>of</str<strong>on</strong>g> Biological Sciences, Fort Hays State University, Hays, KS 67601-4099; brmaricle@fhsu.eduThe effects <str<strong>on</strong>g>of</str<strong>on</strong>g> salinity <strong>on</strong> gross and net photosyn<str<strong>on</strong>g>the</str<strong>on</strong>g>sis rates were measured in estuarine C 4 grasses.Net CO 2 fixati<strong>on</strong> was most affected by increasing salinity in Spartina patens and S. alterniflora,moderately affected in Distichlis spicata and S. densiflora, and unaffected in S. anglica. Spartinaanglica exhibited a decrease in internal carb<strong>on</strong> dioxide (CO 2 ) with increasing salinity, suggestingsome decrease in stomatal c<strong>on</strong>ductance. The results suggest S. anglica has a superior level <str<strong>on</strong>g>of</str<strong>on</strong>g> salttolerance compared to o<str<strong>on</strong>g>the</str<strong>on</strong>g>r species in <str<strong>on</strong>g>the</str<strong>on</strong>g> study, which could have implicati<strong>on</strong>s for communitystructure in field sites or for invasive potential <str<strong>on</strong>g>of</str<strong>on</strong>g> S. anglica. The maximum quantum efficiency <str<strong>on</strong>g>of</str<strong>on</strong>g>CO 2 fixati<strong>on</strong>, measured under limiting light, decreased with increasing salinity in S. alterniflora andS. patens, indicating an increase in leakage <str<strong>on</strong>g>of</str<strong>on</strong>g> CO 2 from <str<strong>on</strong>g>the</str<strong>on</strong>g> CO 2 pump. While carb<strong>on</strong> fixati<strong>on</strong> decreasedunder increasing salinity in most species, fluorescence yield data showed <str<strong>on</strong>g>the</str<strong>on</strong>g>re was little effect<strong>on</strong> <str<strong>on</strong>g>the</str<strong>on</strong>g> use <str<strong>on</strong>g>of</str<strong>on</strong>g> solar energy in photochemistry. This indicates additi<strong>on</strong>al sinks are induced undersalinity for use <str<strong>on</strong>g>of</str<strong>on</strong>g> photochemically generated energy (e.g., increase in <str<strong>on</strong>g>the</str<strong>on</strong>g> CO 2 pump, photorespirati<strong>on</strong>,or Mehler reacti<strong>on</strong>). Also, in S. patens and D. spicata, which had moderate decreases in photosyn<str<strong>on</strong>g>the</str<strong>on</strong>g>sis,n<strong>on</strong>-photochemical quenching (NPQ) mechanisms increased with salinity indicating some<str<strong>on</strong>g>of</str<strong>on</strong>g> <str<strong>on</strong>g>the</str<strong>on</strong>g> excess light energy was lost as heat. Therefore, excess excitati<strong>on</strong> energy was diverted awayfrom <str<strong>on</strong>g>the</str<strong>on</strong>g> photosyn<str<strong>on</strong>g>the</str<strong>on</strong>g>tic reacti<strong>on</strong> centers to prevent photoinhibiti<strong>on</strong>. Variable to maximal fluorescence(F V /F M ) ratios were not significantly decreased by increasing salinity, suggesting <str<strong>on</strong>g>the</str<strong>on</strong>g>re was nodamage to photosystem II (PSII) reacti<strong>on</strong> centers in any species.Keywords: Spartina, Distichlis, chlorophyll fluorescence, gas exchange, salt stressINTRODUCTIONHigh and fluctuating salinity levels are characteristic <str<strong>on</strong>g>of</str<strong>on</strong>g>salt marshes. Elevated soil salinity can cause low waterpotentials, which can decrease stomatal c<strong>on</strong>ductance,reducing incoming CO 2 , and thus reducing photosyn<str<strong>on</strong>g>the</str<strong>on</strong>g>ticrates (Willmer 1983). One aim <str<strong>on</strong>g>of</str<strong>on</strong>g> <str<strong>on</strong>g>the</str<strong>on</strong>g> present study was todetermine how stomatal c<strong>on</strong>ductance and photosyn<str<strong>on</strong>g>the</str<strong>on</strong>g>sis inC 4 salt marsh grasses are affected by envir<strong>on</strong>mental salinity.Gross and net photosyn<str<strong>on</strong>g>the</str<strong>on</strong>g>sis rates were measured underthree salinity levels in <str<strong>on</strong>g>the</str<strong>on</strong>g> estuarine C 4 grasses Spartinaalterniflora, S. anglica, S. patens, S. densiflora, andDistichlis spicata in growth chamber studies. Differences in<str<strong>on</strong>g>the</str<strong>on</strong>g>se parameters were anticipated as a result <str<strong>on</strong>g>of</str<strong>on</strong>g> changes inphotosyn<str<strong>on</strong>g>the</str<strong>on</strong>g>sis as affected by salinity. Primary producti<strong>on</strong>by Spartina is an important input into <str<strong>on</strong>g>the</str<strong>on</strong>g> estuarine system(Peters<strong>on</strong> et al. 1985), so understanding <str<strong>on</strong>g>the</str<strong>on</strong>g> photosyn<str<strong>on</strong>g>the</str<strong>on</strong>g>sisand hence producti<strong>on</strong> <str<strong>on</strong>g>of</str<strong>on</strong>g> this material may be important forunderstanding estuarine ecology and trophic interacti<strong>on</strong>s.MATERIALS AND METHODSPlants were collected at field sites in Washingt<strong>on</strong> (S.alterniflora, S. anglica, and D. spicata), Florida (S. patens),and Spain (S. densiflora). Tillers were potted in a 50/50volume to volume (v/v) sand/potting soil mixture, and plantswere watered to saturati<strong>on</strong> twice weekly with modifiedHoagland soluti<strong>on</strong> (Epstein 1972). Growth chamberc<strong>on</strong>diti<strong>on</strong>s were 14L/10D (light/dark hours) with 26°C daysand 18°C nights. Photosyn<str<strong>on</strong>g>the</str<strong>on</strong>g>tic phot<strong>on</strong> flux density (PPFD)was 300 micromoles per square meter per sec<strong>on</strong>d (μmol m -2s -1 ) at bench level. Flooded treatment plants were placed inlarge plastic tubs in a randomized block design. Water wasmaintained at 2 centimeters (cm) above <str<strong>on</strong>g>the</str<strong>on</strong>g> soil surface andwas completely replaced weekly. Salinity levels wereincreased 15 parts per thousand (‰) per week until floodedtreatments included 0, 15, and 30‰ salt (Instant Ocean salts;Aquarium Systems, Mentor, Ohio). Drained treatmentsc<strong>on</strong>tained 0‰ salt. Plants were held for 30 days under finaltreatment c<strong>on</strong>diti<strong>on</strong>s before testing. There were at least threereplicate plants per species/treatment combinati<strong>on</strong>.Chlorophyll fluorescence was measured with an OS-500modulated fluorometer (Opti-Sciences, Inc.; Tyngsboro,MA). Gross photosyn<str<strong>on</strong>g>the</str<strong>on</strong>g>tic rates <str<strong>on</strong>g>of</str<strong>on</strong>g> O 2 evoluti<strong>on</strong> werecalculated from fluorescence yield measurements after Kralland Edwards (1992). The sec<strong>on</strong>d-youngest leaf <strong>on</strong> each plantwas tested and light-resp<strong>on</strong>se curves were generated forPPFD <str<strong>on</strong>g>of</str<strong>on</strong>g> 15-2000 μmol m -2 s -1 .A FastEst gas exchange system (Maricle et al. 2007) wasused to measure leaf gas exchange <strong>on</strong> high (30‰) and low(0‰) salinity plants. Intact leaves were enclosed in a leafchamber at 25°C and 25% relative humidity. Measures <str<strong>on</strong>g>of</str<strong>on</strong>g> CO 2uptake gave net photosyn<str<strong>on</strong>g>the</str<strong>on</strong>g>sis rates, and measures <str<strong>on</strong>g>of</str<strong>on</strong>g> externalwater vapor allowed calculati<strong>on</strong>s <str<strong>on</strong>g>of</str<strong>on</strong>g> stomatal c<strong>on</strong>ductance and-55-
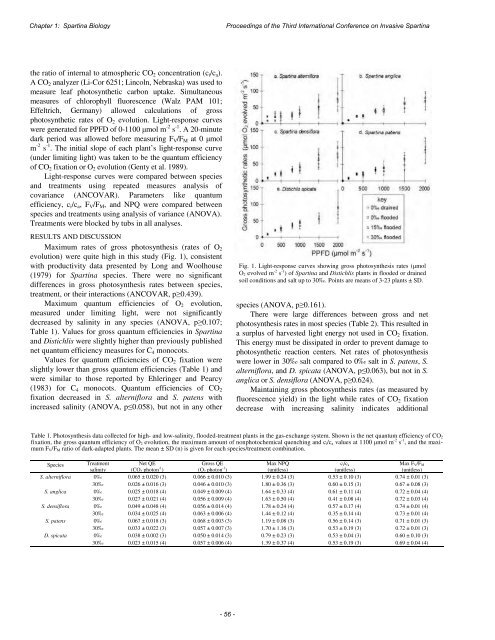
Chapter 1: Spartina Biology<str<strong>on</strong>g>Proceedings</str<strong>on</strong>g> <str<strong>on</strong>g>of</str<strong>on</strong>g> <str<strong>on</strong>g>the</str<strong>on</strong>g> <str<strong>on</strong>g>Third</str<strong>on</strong>g> <str<strong>on</strong>g>Internati<strong>on</strong>al</str<strong>on</strong>g> <str<strong>on</strong>g>C<strong>on</strong>ference</str<strong>on</strong>g> <strong>on</strong> <strong>Invasive</strong> Spartina<str<strong>on</strong>g>the</str<strong>on</strong>g> ratio <str<strong>on</strong>g>of</str<strong>on</strong>g> internal to atmospheric CO 2 c<strong>on</strong>centrati<strong>on</strong> (c i /c a ).A CO 2 analyzer (Li-Cor 6251; Lincoln, Nebraska) was used tomeasure leaf photosyn<str<strong>on</strong>g>the</str<strong>on</strong>g>tic carb<strong>on</strong> uptake. Simultaneousmeasures <str<strong>on</strong>g>of</str<strong>on</strong>g> chlorophyll fluorescence (Walz PAM 101;Effeltrich, Germany) allowed calculati<strong>on</strong>s <str<strong>on</strong>g>of</str<strong>on</strong>g> grossphotosyn<str<strong>on</strong>g>the</str<strong>on</strong>g>tic rates <str<strong>on</strong>g>of</str<strong>on</strong>g> O 2 evoluti<strong>on</strong>. Light-resp<strong>on</strong>se curveswere generated for PPFD <str<strong>on</strong>g>of</str<strong>on</strong>g> 0-1100 μmol m -2 s -1 . A 20-minutedark period was allowed before measuring F V /F M at 0 μmolm -2 s -1 . The initial slope <str<strong>on</strong>g>of</str<strong>on</strong>g> each plant’s light-resp<strong>on</strong>se curve(under limiting light) was taken to be <str<strong>on</strong>g>the</str<strong>on</strong>g> quantum efficiency<str<strong>on</strong>g>of</str<strong>on</strong>g> CO 2 fixati<strong>on</strong> or O 2 evoluti<strong>on</strong> (Genty et al. 1989).Light-resp<strong>on</strong>se curves were compared between speciesand treatments using repeated measures analysis <str<strong>on</strong>g>of</str<strong>on</strong>g>covariance (ANCOVAR). Parameters like quantumefficiency, c i /c a , F V /F M , and NPQ were compared betweenspecies and treatments using analysis <str<strong>on</strong>g>of</str<strong>on</strong>g> variance (ANOVA).Treatments were blocked by tubs in all analyses.RESULTS AND DISCUSSIONMaximum rates <str<strong>on</strong>g>of</str<strong>on</strong>g> gross photosyn<str<strong>on</strong>g>the</str<strong>on</strong>g>sis (rates <str<strong>on</strong>g>of</str<strong>on</strong>g> O 2evoluti<strong>on</strong>) were quite high in this study (Fig. 1), c<strong>on</strong>sistentwith productivity data presented by L<strong>on</strong>g and Woolhouse(1979) for Spartina species. There were no significantdifferences in gross photosyn<str<strong>on</strong>g>the</str<strong>on</strong>g>sis rates between species,treatment, or <str<strong>on</strong>g>the</str<strong>on</strong>g>ir interacti<strong>on</strong>s (ANCOVAR, p≥0.439).Maximum quantum efficiencies <str<strong>on</strong>g>of</str<strong>on</strong>g> O 2 evoluti<strong>on</strong>,measured under limiting light, were not significantlydecreased by salinity in any species (ANOVA, p≥0.107;Table 1). Values for gross quantum efficiencies in Spartinaand Distichlis were slightly higher than previously publishednet quantum efficiency measures for C 4 m<strong>on</strong>ocots.Values for quantum efficiencies <str<strong>on</strong>g>of</str<strong>on</strong>g> CO 2 fixati<strong>on</strong> wereslightly lower than gross quantum efficiencies (Table 1) andwere similar to those reported by Ehleringer and Pearcy(1983) for C 4 m<strong>on</strong>ocots. Quantum efficiencies <str<strong>on</strong>g>of</str<strong>on</strong>g> CO 2fixati<strong>on</strong> decreased in S. alterniflora and S. patens withincreased salinity (ANOVA, p≤0.058), but not in any o<str<strong>on</strong>g>the</str<strong>on</strong>g>rFig. 1. Light-resp<strong>on</strong>se curves showing gross photosyn<str<strong>on</strong>g>the</str<strong>on</strong>g>sis rates (μmolO 2 evolved m -2 s -1 ) <str<strong>on</strong>g>of</str<strong>on</strong>g> Spartina and Distichlis plants in flooded or drainedsoil c<strong>on</strong>diti<strong>on</strong>s and salt up to 30‰. Points are means <str<strong>on</strong>g>of</str<strong>on</strong>g> 3-23 plants ± SD.species (ANOVA, p≥0.161).There were large differences between gross and netphotosyn<str<strong>on</strong>g>the</str<strong>on</strong>g>sis rates in most species (Table 2). This resulted ina surplus <str<strong>on</strong>g>of</str<strong>on</strong>g> harvested light energy not used in CO 2 fixati<strong>on</strong>.This energy must be dissipated in order to prevent damage tophotosyn<str<strong>on</strong>g>the</str<strong>on</strong>g>tic reacti<strong>on</strong> centers. Net rates <str<strong>on</strong>g>of</str<strong>on</strong>g> photosyn<str<strong>on</strong>g>the</str<strong>on</strong>g>siswere lower in 30‰ salt compared to 0‰ salt in S. patens, S.alterniflora, and D. spicata (ANOVA, p≤0.063), but not in S.anglica or S. densiflora (ANOVA, p≥0.624).Maintaining gross photosyn<str<strong>on</strong>g>the</str<strong>on</strong>g>sis rates (as measured byfluorescence yield) in <str<strong>on</strong>g>the</str<strong>on</strong>g> light while rates <str<strong>on</strong>g>of</str<strong>on</strong>g> CO 2 fixati<strong>on</strong>decrease with increasing salinity indicates additi<strong>on</strong>alTable 1. Photosyn<str<strong>on</strong>g>the</str<strong>on</strong>g>sis data collected for high- and low-salinity, flooded-treatment plants in <str<strong>on</strong>g>the</str<strong>on</strong>g> gas-exchange system. Shown is <str<strong>on</strong>g>the</str<strong>on</strong>g> net quantum efficiency <str<strong>on</strong>g>of</str<strong>on</strong>g> CO 2fixati<strong>on</strong>, <str<strong>on</strong>g>the</str<strong>on</strong>g> gross quantum efficiency <str<strong>on</strong>g>of</str<strong>on</strong>g> O 2 evoluti<strong>on</strong>, <str<strong>on</strong>g>the</str<strong>on</strong>g> maximum amount <str<strong>on</strong>g>of</str<strong>on</strong>g> n<strong>on</strong>photochemical quenching and c i/c a values at 1100 μmol m -2 s -1 , and <str<strong>on</strong>g>the</str<strong>on</strong>g> maximumF V/F M ratio <str<strong>on</strong>g>of</str<strong>on</strong>g> dark-adapted plants. The mean ± SD (n) is given for each species/treatment combinati<strong>on</strong>.Species TreatmentsalinityNet QE(CO 2 phot<strong>on</strong> -1 )Gross QE(O 2 phot<strong>on</strong> -1 )Max NPQ(unitless)c i/c a(unitless)Max F V/F M(unitless)S. alterniflora 0‰ 0.065 ± 0.020 (3) 0.066 ± 0.010 (3) 1.99 ± 0.24 (3) 0.53 ± 0.10 (3) 0.74 ± 0.01 (3)30‰ 0.026 ± 0.016 (3) 0.046 ± 0.010 (3) 1.80 ± 0.36 (3) 0.60 ± 0.15 (3) 0.67 ± 0.08 (3)S. anglica 0‰ 0.025 ± 0.018 (4) 0.049 ± 0.009 (4) 1.64 ± 0.33 (4) 0.61 ± 0.11 (4) 0.72 ± 0.04 (4)30‰ 0.027 ± 0.021 (4) 0.056 ± 0.009 (4) 1.63 ± 0.50 (4) 0.41 ± 0.08 (4) 0.72 ± 0.03 (4)S. densiflora 0‰ 0.049 ± 0.048 (4) 0.056 ± 0.014 (4) 1.78 ± 0.24 (4) 0.57 ± 0.17 (4) 0.74 ± 0.01 (4)30‰ 0.034 ± 0.025 (4) 0.063 ± 0.006 (4) 1.44 ± 0.12 (4) 0.35 ± 0.14 (4) 0.73 ± 0.01 (4)S. patens 0‰ 0.067 ± 0.018 (3) 0.068 ± 0.003 (3) 1.19 ± 0.08 (3) 0.56 ± 0.14 (3) 0.71 ± 0.01 (3)30‰ 0.033 ± 0.022 (3) 0.057 ± 0.007 (3) 1.70 ± 1.16 (3) 0.53 ± 0.19 (3) 0.72 ± 0.01 (3)D. spicata 0‰ 0.038 ± 0.002 (3) 0.050 ± 0.014 (3) 0.79 ± 0.23 (3) 0.53 ± 0.04 (3) 0.60 ± 0.10 (3)30‰ 0.023 ± 0.015 (4) 0.057 ± 0.006 (4) 1.39 ± 0.37 (4) 0.53 ± 0.19 (3) 0.69 ± 0.04 (4)-56-
- Page 2 and 3:
Proceedings <stron
- Page 4 and 5:
FORWARD & ACKNOWLEDGEMENTSThe <stro
- Page 6 and 7:
TABLE OF CONTENTSForward & Acknowle
- Page 9 and 10:
Community Spartina Education and St
- Page 11 and 12:
included the docum
- Page 14:
CHAPTER ONESpartina Biology
- Page 17 and 18: Chapter 1: Spartina Biology
- Page 19 and 20: Chapter 1: Spartina Biology
- Page 21 and 22: Chapter 1: Spartina Biology
- Page 23 and 24: Chapter 1: Spartina Biology
- Page 25 and 26: Chapter 1: Spartina Biology
- Page 28 and 29: Proceedings <stron
- Page 30 and 31: Proceedings <stron
- Page 32 and 33: Proceedings <stron
- Page 34: Proceedings <stron
- Page 37 and 38: Chapter 1: Spartina Biology
- Page 39 and 40: Chapter 1: Spartina Biology
- Page 42 and 43: Proceedings <stron
- Page 44: Proceedings <stron
- Page 47 and 48: Chapter 1: Spartina Biology
- Page 49 and 50: Chapter 1: Spartina Biology
- Page 51 and 52: Chapter 1: Spartina Biology
- Page 53 and 54: Chapter 1: Spartina Biology
- Page 55 and 56: Chapter 1: Spartina Biology
- Page 57 and 58: Chapter 1: Spartina Biology
- Page 60 and 61: Proceedings <stron
- Page 62 and 63: Proceedings <stron
- Page 64 and 65: Proceedings <stron
- Page 66: Proceedings <stron
- Page 71 and 72: Chapter 1: Spartina Biology
- Page 74 and 75: Proceedings <stron
- Page 76: Proceedings <stron
- Page 79 and 80: Chapter 2: Spartina Distribution an
- Page 81 and 82: Chapter 2: Spartina Distribution an
- Page 83 and 84: Chapter 2: Spartina Distribution an
- Page 86 and 87: Proceedings <stron
- Page 88 and 89: Proceedings <stron
- Page 90 and 91: Proceedings <stron
- Page 92 and 93: Proceedings <stron
- Page 94 and 95: Proceedings <stron
- Page 96 and 97: Proceedings <stron
- Page 98: Proceedings <stron
- Page 101 and 102: Chapter 2: Spartina Distribution an
- Page 103 and 104: Chapter 2: Spartina Distribution an
- Page 105 and 106: Chapter 2: Spartina Distribution an
- Page 108 and 109: Proceedings <stron
- Page 110: Proceedings <stron
- Page 113 and 114: Chapter 2: Spartina Distribution an
- Page 115 and 116: Chapter 2: Spartina Distribution an
- Page 117 and 118:
Chapter 2: Spartina Distribution an
- Page 119 and 120:
Chapter 2: Spartina Distribution an
- Page 122 and 123:
Proceedings <stron
- Page 124 and 125:
Proceedings <stron
- Page 126 and 127:
Proceedings <stron
- Page 128:
Proceedings <stron
- Page 131 and 132:
Chapter 2: Spartina Distribution an
- Page 134 and 135:
Proceedings <stron
- Page 136 and 137:
Proceedings <stron
- Page 138 and 139:
Proceedings <stron
- Page 140:
CHAPTER THREEEcosystem Effects <str
- Page 143 and 144:
Chapter 3: Ecosystem Effects <stron
- Page 145 and 146:
Chapter 3: Ecosystem Effects <stron
- Page 148 and 149:
Proceedings <stron
- Page 150 and 151:
Proceedings <stron
- Page 152:
Proceedings <stron
- Page 155 and 156:
Chapter 3: Ecosystem Effects <stron
- Page 157 and 158:
Chapter 3: Ecosystem Effects <stron
- Page 160 and 161:
Proceedings <stron
- Page 162 and 163:
Proceedings <stron
- Page 164:
Proceedings <stron
- Page 167 and 168:
Chapter 3: Ecosystem Effects <stron
- Page 169 and 170:
Chapter 3: Ecosystem Effects <stron
- Page 171 and 172:
Chapter 3: Ecosystem Effects <stron
- Page 174 and 175:
Proceedings <stron
- Page 176:
Proceedings <stron
- Page 179 and 180:
Chapter 3: Ecosystem Effects <stron
- Page 181 and 182:
Chapter 3: Ecosystem Effects <stron
- Page 184 and 185:
Proceedings <stron
- Page 186 and 187:
Proceedings <stron
- Page 188 and 189:
Proceedings <stron
- Page 190 and 191:
Proceedings <stron
- Page 192 and 193:
Proceedings <stron
- Page 194 and 195:
Proceedings <stron
- Page 196:
Proceedings <stron
- Page 199 and 200:
Chapter 3: Ecosystem Effects <stron
- Page 201 and 202:
Chapter 3: Ecosystem Effects <stron
- Page 204 and 205:
Proceedings <stron
- Page 206 and 207:
Proceedings <stron
- Page 208 and 209:
Proceedings <stron
- Page 210 and 211:
Proceedings <stron
- Page 212:
Proceedings <stron
- Page 216 and 217:
Proceedings <stron
- Page 218 and 219:
Proceedings <stron
- Page 220 and 221:
Proceedings <stron
- Page 222 and 223:
Proceedings <stron
- Page 224 and 225:
Proceedings <stron
- Page 226 and 227:
Proceedings <stron
- Page 228 and 229:
Proceedings <stron
- Page 230 and 231:
Proceedings <stron
- Page 232 and 233:
Proceedings <stron
- Page 234 and 235:
Proceedings <stron
- Page 236 and 237:
Proceedings <stron
- Page 238 and 239:
Proceedings <stron
- Page 240 and 241:
Proceedings <stron
- Page 242 and 243:
Proceedings <stron
- Page 244 and 245:
Proceedings <stron
- Page 246:
Proceedings <stron
- Page 249 and 250:
Chapter 4: Spartina Control and Man
- Page 251 and 252:
Chapter 4: Spartina Control and Man
- Page 253 and 254:
Chapter 4: Spartina Control and Man
- Page 255 and 256:
Chapter 4: Spartina Control and Man
- Page 257 and 258:
Chapter 4: Spartina Control and Man
- Page 259 and 260:
Chapter 4: Spartina Control and Man
- Page 261 and 262:
Chapter 4: Spartina Control and Man
- Page 263 and 264:
Chapter 4: Spartina Control and Man
- Page 265 and 266:
Chapter 4: Spartina Control and Man
- Page 267 and 268:
Chapter 4: Spartina Control and Man
- Page 269 and 270:
Chapter 4: Spartina Control and Man
- Page 271 and 272:
Chapter 4: Spartina Control and Man
- Page 273 and 274:
Chapter 4: Spartina Control and Man
- Page 276 and 277:
Proceedings <stron
- Page 278 and 279:
Proceedings <stron
- Page 280 and 281:
Proceedings <stron
- Page 282 and 283:
Proceedings <stron
- Page 284 and 285:
Proceedings <stron
- Page 286 and 287:
Proceedings <stron
- Page 288 and 289:
Proceedings <stron
- Page 290:
Proceedings <stron