Proceedings of the Third International Conference on Invasive ...
Proceedings of the Third International Conference on Invasive ...
Proceedings of the Third International Conference on Invasive ...
- No tags were found...

You also want an ePaper? Increase the reach of your titles
YUMPU automatically turns print PDFs into web optimized ePapers that Google loves.
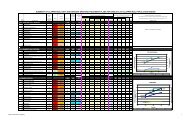
<str<strong>on</strong>g>Proceedings</str<strong>on</strong>g> <str<strong>on</strong>g>of</str<strong>on</strong>g> <str<strong>on</strong>g>the</str<strong>on</strong>g> <str<strong>on</strong>g>Third</str<strong>on</strong>g> <str<strong>on</strong>g>Internati<strong>on</strong>al</str<strong>on</strong>g> <str<strong>on</strong>g>C<strong>on</strong>ference</str<strong>on</strong>g> <strong>on</strong> <strong>Invasive</strong> SpartinaChapter 3: Ecosystem Effects <str<strong>on</strong>g>of</str<strong>on</strong>g> <strong>Invasive</strong> Spartinacorrecti<strong>on</strong> standards were IAEA S-1 (silver sulfide δ 34 S V-CDT= -0.3‰) and Iso-Analytical IA-R025 (barium sulfateδ 34 S V-CDT = +8.53‰). IA-R025 (barium sulfate δ 34 S V-CDT =+8.53‰) and whale baleen (δ 34 S V-CDT = +16.30‰) wereused as internal standards.The IsoSource isotopic mixing model analysisapplicati<strong>on</strong> (www.epa.gov/wed/pages/models.htm; Phillipsand Gregg 2003) was used to estimate <str<strong>on</strong>g>the</str<strong>on</strong>g> feasiblec<strong>on</strong>tributi<strong>on</strong>s <str<strong>on</strong>g>of</str<strong>on</strong>g> S. anglica and six o<str<strong>on</strong>g>the</str<strong>on</strong>g>r potential sources to<str<strong>on</strong>g>the</str<strong>on</strong>g> diets <str<strong>on</strong>g>of</str<strong>on</strong>g> Macoma, Mya, and Mytilus. IsoSource calculates<str<strong>on</strong>g>the</str<strong>on</strong>g> ranges <str<strong>on</strong>g>of</str<strong>on</strong>g> all possible source c<strong>on</strong>tributi<strong>on</strong>s when <str<strong>on</strong>g>the</str<strong>on</strong>g>number <str<strong>on</strong>g>of</str<strong>on</strong>g> sources placed in <str<strong>on</strong>g>the</str<strong>on</strong>g> mixing model exceeds n+1,where n is <str<strong>on</strong>g>the</str<strong>on</strong>g> number <str<strong>on</strong>g>of</str<strong>on</strong>g> isotopic tracers (e.g. δ 13 C or δ 34 S;Phillips and Gregg 2003). Therefore, IsoSource allowssource c<strong>on</strong>tributi<strong>on</strong>s to a mixture to be estimated regardless<str<strong>on</strong>g>of</str<strong>on</strong>g> <str<strong>on</strong>g>the</str<strong>on</strong>g> number <str<strong>on</strong>g>of</str<strong>on</strong>g> sources and isotopic tracers available. In<str<strong>on</strong>g>the</str<strong>on</strong>g>se circumstances unique soluti<strong>on</strong>s cannot be obtained dueto <str<strong>on</strong>g>the</str<strong>on</strong>g> use <str<strong>on</strong>g>of</str<strong>on</strong>g> large numbers <str<strong>on</strong>g>of</str<strong>on</strong>g> sources in <str<strong>on</strong>g>the</str<strong>on</strong>g> mixing model(Phillips and Gregg 2003). Since unique soluti<strong>on</strong>s cannot bedetermined, IsoSource output provides ranges <str<strong>on</strong>g>of</str<strong>on</strong>g> all possiblesource c<strong>on</strong>tributi<strong>on</strong>s to <str<strong>on</strong>g>the</str<strong>on</strong>g> mixture based <strong>on</strong> mass balancecalculati<strong>on</strong>s (Table 1; Phillips and Gregg 2003). The morenarrow <str<strong>on</strong>g>the</str<strong>on</strong>g> range <str<strong>on</strong>g>of</str<strong>on</strong>g> <str<strong>on</strong>g>the</str<strong>on</strong>g>se soluti<strong>on</strong>s (e.g 30%-50% vs. 10-70%), <str<strong>on</strong>g>the</str<strong>on</strong>g> more reliable <str<strong>on</strong>g>the</str<strong>on</strong>g> interpretati<strong>on</strong> <str<strong>on</strong>g>of</str<strong>on</strong>g> sourcec<strong>on</strong>tributi<strong>on</strong>s to <str<strong>on</strong>g>the</str<strong>on</strong>g> mixture can be. Thus, IsoSource is veryuseful for studies <str<strong>on</strong>g>of</str<strong>on</strong>g> trophic relati<strong>on</strong>ships where numerousfood sources could exist for a c<strong>on</strong>sumer. IsoSource has beenapplied to a variety <str<strong>on</strong>g>of</str<strong>on</strong>g> trophic studies inside and outside <str<strong>on</strong>g>of</str<strong>on</strong>g>estuaries (e.g. Felicetti et al. 2003; Melville and C<strong>on</strong>nolly2003; Ben-David et al. 2004; Newsome et al. 2004).The carb<strong>on</strong> isotope ratios <str<strong>on</strong>g>of</str<strong>on</strong>g> <str<strong>on</strong>g>the</str<strong>on</strong>g> bivalves were adjustedby a 1‰ fracti<strong>on</strong>ati<strong>on</strong> factor based <strong>on</strong> Peters<strong>on</strong> and Fry(1987), Vander Zanden and Rasmussen (1999), andMcCutchan et al. (2003). Sulfur appears to have little to n<str<strong>on</strong>g>of</str<strong>on</strong>g>racti<strong>on</strong>ati<strong>on</strong> associated with its movement through trophiclevels. Due to <str<strong>on</strong>g>the</str<strong>on</strong>g> scarcity <str<strong>on</strong>g>of</str<strong>on</strong>g> sulfur fracti<strong>on</strong>ati<strong>on</strong> data(McCutchan et al. 2003), <str<strong>on</strong>g>the</str<strong>on</strong>g> typical assumpti<strong>on</strong> that <str<strong>on</strong>g>the</str<strong>on</strong>g>re isminimal fracti<strong>on</strong>ati<strong>on</strong> <str<strong>on</strong>g>of</str<strong>on</strong>g> sulfur was applied (Peters<strong>on</strong> andHowarth 1987). A biomass c<strong>on</strong>tributi<strong>on</strong> increment <str<strong>on</strong>g>of</str<strong>on</strong>g> 1%and a tolerance interval <str<strong>on</strong>g>of</str<strong>on</strong>g> 0.11‰ was used for all IsoSourceanalyses to insure that <str<strong>on</strong>g>the</str<strong>on</strong>g> full range <str<strong>on</strong>g>of</str<strong>on</strong>g> feasible soluti<strong>on</strong>swas generated (Table 1).RESULTSMacoma (n=12) clustered close to <str<strong>on</strong>g>the</str<strong>on</strong>g> outer edge <str<strong>on</strong>g>of</str<strong>on</strong>g>mixing polyg<strong>on</strong> in close proximity to living and deadSpartina tissue (Figure 1A). Only living tissue <str<strong>on</strong>g>of</str<strong>on</strong>g> Spartinawas c<strong>on</strong>sidered to be a comp<strong>on</strong>ent <str<strong>on</strong>g>of</str<strong>on</strong>g> <str<strong>on</strong>g>the</str<strong>on</strong>g> diet <str<strong>on</strong>g>of</str<strong>on</strong>g> Macoma inall soluti<strong>on</strong>s <str<strong>on</strong>g>of</str<strong>on</strong>g> <str<strong>on</strong>g>the</str<strong>on</strong>g> mixing model with c<strong>on</strong>tributi<strong>on</strong>s rangingfrom 37-60% (Table 1). Five <str<strong>on</strong>g>of</str<strong>on</strong>g> <str<strong>on</strong>g>the</str<strong>on</strong>g> six productivity sourcessampled could be absent in <str<strong>on</strong>g>the</str<strong>on</strong>g> diet <str<strong>on</strong>g>of</str<strong>on</strong>g> Macoma (Table 1).Four Mya clustered near <str<strong>on</strong>g>the</str<strong>on</strong>g> center <str<strong>on</strong>g>of</str<strong>on</strong>g> <str<strong>on</strong>g>the</str<strong>on</strong>g> mixingpolyg<strong>on</strong> while three o<str<strong>on</strong>g>the</str<strong>on</strong>g>r individuals clustered close toSpartina (Figure 1B). IsoSource indicated that Mya couldreceive 40-59% <str<strong>on</strong>g>of</str<strong>on</strong>g> its diet from living Spartina tissue andTable 1. IsoSource results. Ranges <str<strong>on</strong>g>of</str<strong>on</strong>g> feasible biomass source c<strong>on</strong>tributi<strong>on</strong>sfor <str<strong>on</strong>g>the</str<strong>on</strong>g> each bivalve summarized from 34,854 mass balanced mixingmodel soluti<strong>on</strong>s (Macoma balthica), 23,996 soluti<strong>on</strong>s (Mya arenaria), and56,083 soluti<strong>on</strong>s (Mytilus sp.). Each distributi<strong>on</strong> is defined by <str<strong>on</strong>g>the</str<strong>on</strong>g> minimumand maximum values as well as <str<strong>on</strong>g>the</str<strong>on</strong>g> 1 st and 99 th percentiles. The percentilesrepresent 98% <str<strong>on</strong>g>of</str<strong>on</strong>g> all <str<strong>on</strong>g>the</str<strong>on</strong>g> possible IsoSource soluti<strong>on</strong>s. The meanpercent <str<strong>on</strong>g>of</str<strong>on</strong>g> each source distributi<strong>on</strong> is cited to show central tendency <str<strong>on</strong>g>of</str<strong>on</strong>g> <str<strong>on</strong>g>the</str<strong>on</strong>g>distributi<strong>on</strong> <strong>on</strong>ly and should not be c<strong>on</strong>sidered a point estimate <str<strong>on</strong>g>of</str<strong>on</strong>g> <str<strong>on</strong>g>the</str<strong>on</strong>g>source c<strong>on</strong>tributi<strong>on</strong> to <str<strong>on</strong>g>the</str<strong>on</strong>g> diet <str<strong>on</strong>g>of</str<strong>on</strong>g> <str<strong>on</strong>g>the</str<strong>on</strong>g> bivalve.Source C<strong>on</strong>sumer Biomass %Minimum 1% Mean 99% MaximumSpartina (living leaves) Macoma 37 41 52 59 60Mya 40 44 53 58 59Mytilus 19 24 36 43 44Spartina (standing dead) Macoma 0 0 15 38 46Mya 0 0 8 27 35Mytilus 0 0 11 36 46Distichlis spicata Macoma 0 0 10 26 31Mya 0 0 6 19 24Mytilus 0 0 8 25 32C 3 Vascular Plants Macoma 0 0 5 15 17Salicornia virginica Mya 3 5 14 23 26Grindelia integrifolia Mytilus 5 8 20 32 35Zostera marina Macoma 0 0 9 28 33Mya 0 0 10 32 40Mytilus 0 0 13 42 52Macroalgae Macoma 0 0 9 26 31Fucus spiralis Mya 0 0 9 30 38Mytilus 0 0 12 40 503-26% <str<strong>on</strong>g>of</str<strong>on</strong>g> its diet from C 3 vegetati<strong>on</strong>. All o<str<strong>on</strong>g>the</str<strong>on</strong>g>r sources hadwide ranges <str<strong>on</strong>g>of</str<strong>on</strong>g> potential producer c<strong>on</strong>tributi<strong>on</strong>s that includedzero as likely dietary c<strong>on</strong>tributi<strong>on</strong>s (Table 1).Living Spartina biomass and C 3 vegetati<strong>on</strong> were <str<strong>on</strong>g>the</str<strong>on</strong>g><strong>on</strong>ly dietary sources that IsoSource included within all <str<strong>on</strong>g>of</str<strong>on</strong>g> <str<strong>on</strong>g>the</str<strong>on</strong>g>feasible soluti<strong>on</strong>s for Mytilus. Living Spartina couldc<strong>on</strong>tribute 19-44% to <str<strong>on</strong>g>the</str<strong>on</strong>g> diet <str<strong>on</strong>g>of</str<strong>on</strong>g> Mytilus, whereas C 3vegetati<strong>on</strong> may c<strong>on</strong>tribute 5-35% <str<strong>on</strong>g>of</str<strong>on</strong>g> its diet. All o<str<strong>on</strong>g>the</str<strong>on</strong>g>rpotential sources included 0% as <str<strong>on</strong>g>the</str<strong>on</strong>g> most frequent feasiblec<strong>on</strong>tributi<strong>on</strong> (Table 1). Six <str<strong>on</strong>g>of</str<strong>on</strong>g> <str<strong>on</strong>g>the</str<strong>on</strong>g> seven individuals <str<strong>on</strong>g>of</str<strong>on</strong>g>Mytilus clustered in <str<strong>on</strong>g>the</str<strong>on</strong>g> center <str<strong>on</strong>g>of</str<strong>on</strong>g> <str<strong>on</strong>g>the</str<strong>on</strong>g> mixing polyg<strong>on</strong> while<strong>on</strong>e individual was more depleted in its δ 34 S signature(Fig. 1C).DISCUSSIONOur mixing models present evidence that Spartinaanglica is c<strong>on</strong>sumed by bivalves. The use <str<strong>on</strong>g>of</str<strong>on</strong>g> Spartina byMacoma is particularly c<strong>on</strong>vincing based <strong>on</strong> <str<strong>on</strong>g>the</str<strong>on</strong>g> c<strong>on</strong>strainedmixing model soluti<strong>on</strong> and <str<strong>on</strong>g>the</str<strong>on</strong>g> proximity <str<strong>on</strong>g>of</str<strong>on</strong>g> individuals to<str<strong>on</strong>g>the</str<strong>on</strong>g> isotopic signatures <str<strong>on</strong>g>of</str<strong>on</strong>g> living and dead Spartina (Fig. 1A).The mixing model for Mya is also c<strong>on</strong>vincing, although <str<strong>on</strong>g>the</str<strong>on</strong>g>δ 13 C values tend to be more depleted than those <str<strong>on</strong>g>of</str<strong>on</strong>g> Macomapotentially indicating smaller Spartina c<strong>on</strong>tributi<strong>on</strong>s to itsdiet compared to Macoma. With <str<strong>on</strong>g>the</str<strong>on</strong>g> excepti<strong>on</strong> <str<strong>on</strong>g>of</str<strong>on</strong>g> <strong>on</strong>eoutlying individual, Mytilus had <str<strong>on</strong>g>the</str<strong>on</strong>g> most c<strong>on</strong>sistent isotopicsignatures for δ 13 C and δ 34 S, and <str<strong>on</strong>g>the</str<strong>on</strong>g> lowest ranges <str<strong>on</strong>g>of</str<strong>on</strong>g>potential Spartina c<strong>on</strong>tributi<strong>on</strong>s. As a suspensi<strong>on</strong> feedingmussel, Mytilus should be drawing its food from <str<strong>on</strong>g>the</str<strong>on</strong>g>- 155 -