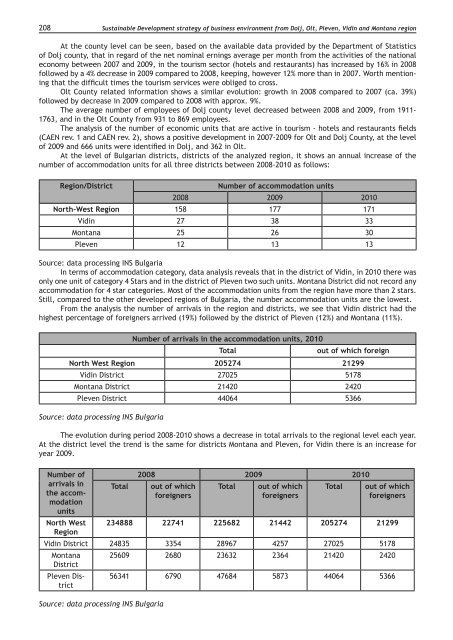
208Sustainable Development strategy of business envi<strong>ro</strong>nment f<strong>ro</strong>m Dolj, Olt, Pleven, Vidin and Montana regionAt the county level can be seen, based on the available data p<strong>ro</strong>vi<st<strong>ro</strong>ng>de</st<strong>ro</strong>ng>d by the Department of Statisticsof Dolj county, that in regard of the net nominal ernings average per month f<strong>ro</strong>m the activities of the nationaleconomy between 2007 and 2009, in the tourism sector (hotels and restaurants) has increased by 16% in 2008followed by a 4% <st<strong>ro</strong>ng>de</st<strong>ro</strong>ng>crease in 2009 compared to 2008, keeping, however 12% more than in 2007. Worth mentioningthat the difficult times the tourism services were obliged to c<strong>ro</strong>ss.Olt County related information shows a similar evolution: g<strong>ro</strong>wth in 2008 compared to 2007 (ca. 39%)followed by <st<strong>ro</strong>ng>de</st<strong>ro</strong>ng>crease in 2009 compared to 2008 with app<strong>ro</strong>x. 9%.The average number of employees of Dolj county level <st<strong>ro</strong>ng>de</st<strong>ro</strong>ng>creased between 2008 and 2009, f<strong>ro</strong>m 1911-1763, and in the Olt County f<strong>ro</strong>m 931 to 869 employees.The analysis of the number of economic units that are active in tourism - hotels and restaurants fields(CAEN rev. 1 and CAEN rev. 2), shows a positive <st<strong>ro</strong>ng>de</st<strong>ro</strong>ng>velopment in 2007-2009 for Olt and Dolj County, at the levelof 2009 and 666 units were i<st<strong>ro</strong>ng>de</st<strong>ro</strong>ng>ntified in Dolj, and 362 in Olt.At the level of Bulgarian districts, districts of the analyzed region, it shows an annual increase of thenumber of accommodation units for all three districts between 2008-2010 as follows:Region/District Number of accommodation units2008 2009 2010North-West Region 158 177 171Vidin 27 38 33Montana 25 26 30Pleven 12 13 13Source: data p<strong>ro</strong>cessing INS BulgariaIn terms of accommodation category, data analysis reveals that in the district of Vidin, in 2010 there wasonly one unit of category 4 Stars and in the district of Pleven two such units. Montana District did not record anyaccommodation for 4 star categories. Most of the accommodation units f<strong>ro</strong>m the region have more than 2 stars.Still, compared to the other <st<strong>ro</strong>ng>de</st<strong>ro</strong>ng>veloped regions of Bulgaria, the number accommodation units are the lowest.F<strong>ro</strong>m the analysis the number of arrivals in the region and districts, we see that Vidin district had thehighest percentage of foreigners arrived (19%) followed by the district of Pleven (12%) and Montana (11%).Number of arrivals in the accommodation units, 2010Totalout of which foreignNorth West Region 205274 21299Vidin District 27025 5178Montana District 21420 2420Pleven District 44064 5366Source: data p<strong>ro</strong>cessing INS BulgariaThe evolution during period 2008-2010 shows a <st<strong>ro</strong>ng>de</st<strong>ro</strong>ng>crease in total arrivals to the regional level each year.At the district level the trend is the same for districts Montana and Pleven, for Vidin there is an increase foryear 2009.Number ofarrivals inthe accommodationunitsNorth WestRegionTotal2008 2009 2010out of which Total out of which Total out of whichforeignersforeignersforeigners234888 22741 225682 21442 205274 21299Vidin District 24835 3354 28967 4257 27025 5178Montana 25609 2680 23632 2364 21420 2420DistrictPleven District56341 6790 47684 5873 44064 5366Source: data p<strong>ro</strong>cessing INS Bulgaria
Sustainable Development strategy of business envi<strong>ro</strong>nment f<strong>ro</strong>m Dolj, Olt, Pleven, Vidin and Montana region 209To mention that, for Vidin district, the number of arrivals of foreigners increased constant in the periodun<st<strong>ro</strong>ng>de</st<strong>ro</strong>ng>r review, even if the total number of arrivals is fluctuating.ServicesAt the district level of Dolj, in the service sector, the evolution of the net nominal ernings averageper month f<strong>ro</strong>m the activities of the national economy between 2007 and 2009 shows that in most of serviceshave been registered increases in 2008 and 2009. The services in which the net nominal ernings averageper month was lower in 2009 than in 2008 (according to the same CAEN co<st<strong>ro</strong>ng>de</st<strong>ro</strong>ng>) are the distribution of water,sanitation, waste management, <st<strong>ro</strong>ng>de</st<strong>ro</strong>ng>contamination activities, administrative services and support services.For the Olt County, f<strong>ro</strong>m the available data f<strong>ro</strong>m Statistics County Department, the services forwhich there has been a <st<strong>ro</strong>ng>de</st<strong>ro</strong>ng>crease in the net nominal ernings per month were: hotels and restaurants, financialintermediation and insurance, real estate, the Service of public administration and <st<strong>ro</strong>ng>de</st<strong>ro</strong>ng>fense, socialsecurity public system.According to available data for the year 2009, the service sector totaled 14,116 companies active inthe service sector in Dolj County. Out of these, 47.5% were active in tra<st<strong>ro</strong>ng>de</st<strong>ro</strong>ng> companies, representing 6710companies. The field with the most active companies ranked f<strong>ro</strong>m trading was the p<strong>ro</strong>fessional, scientificand technical activities with a 7.5 percent of all enterprises active in the county.In the Olt county number of companies in the services sector was of 4822, 3042 of which a number oftra<st<strong>ro</strong>ng>de</st<strong>ro</strong>ng>, meaning less than 63%. The largest service companies, except those <st<strong>ro</strong>ng>de</st<strong>ro</strong>ng>aling with the tra<st<strong>ro</strong>ng>de</st<strong>ro</strong>ng> activitywere those in hotels and restaurants, followed a short distance f<strong>ro</strong>m transport companies and warehousingsector and then f<strong>ro</strong>m those in the p<strong>ro</strong>fessional activities, scientific and technical (the latter with apercentage of only 4.7% of all enterprises active in the entire Olt county).Information technologyIn Dolj County there were 211 units with main economic activity in information technology services.The number of those were recording p<strong>ro</strong>fit was 109. In terms of location, they are located mostly in thecounty town, only 7% could be found in small towns, including in rural areas (Bailesti, Bratovoieşti, Ciuperceni,Galicia, Marsan, Vârvoru bottom, Calafat).For Olt County, the analysis reveals a number of 42 such economic units, 38% of them with headquartersin localities other than the county town, but only four companies with headquarters in rural areas ofthe county.At the level of Bulgaria the number of companies that have Internet access (ICT) is constantly increasingin recent years, f<strong>ro</strong>m 61.7% in 2004 to 83.9% in 2009, an increase of over 22 percent in six years.P<strong>ro</strong>cent firme 2004 2005 2006 2007 2008 2009care au accesla internetTotal Bulgaria 61,7 % 62,5 % 74,7 % 74,8 % 83,4 % 83,9 %Source: Manufacturing date INS BulgariaThe percentage increases significantly for medium firms having between 50-249 employees) and largecompanies (with over 250 employees), meaning up to 94.5% and 98.6%, according to INS data for 2009.Also the number of companies using ERP software - integrated business management software is g<strong>ro</strong>wingin 2009 compared to 2008 - year that saw a <st<strong>ro</strong>ng>de</st<strong>ro</strong>ng>crease compared to 2007). Thus for 2009 medium companies (50-249 employees) that were using such software represented a percentage equal to that of 2007 - namely 13%,even though in real numbers, number of companies is higher (677 in 2009 to 504 in 2007). For large companieswith over 250 employees the percentage is higher than that recor<st<strong>ro</strong>ng>de</st<strong>ro</strong>ng>d in 2007 - 29.5% to 27.9%.Research – Development – Innovation Sector (RDI)According to the the stud\y Reindustrialization of Romania 18 ” Romania is among countries with thelowest rate of investment in this area, only 0.58% in 2008. The situation worsened in 2009 when publicexpenditure returned to the level existing before the boom, 0.2% of GDP respectively. Weak contributionof the private sector (less than 30% of the total investment in R & D) is explained by the type of competitionin the domestic market based on price rather than innovation. In addition, public research fundsare used ineffective because they fail to create a spread effect in the private sector. There is also a badconnection between aca<st<strong>ro</strong>ng>de</st<strong>ro</strong>ng>mic research and industrial applications. In the Eu<strong>ro</strong>pean Union the main contributioncomes f<strong>ro</strong>m the business sector and, unlike Romania, private nonp<strong>ro</strong>fit sector, which also investsin research and <st<strong>ro</strong>ng>de</st<strong>ro</strong>ng>velopment”.18 November 2010, pag. 76.


