- Page 1 and 2:
1Environmental Problems, TheirCause
- Page 3 and 4:
AirSOLAR ENERGYRESOURCESWaterEnergy
- Page 5 and 6:
changes that lead to an increasingl
- Page 7 and 8:
take the resources of 1.15 planet e
- Page 9 and 10:
Causes of Environmental Problems•
- Page 11 and 12:
Developing Countriesxx=Population (
- Page 13 and 14:
■ We should encourage earth-susta
- Page 15 and 16:
2. Write two-page scenarios describ
- Page 17 and 18:
A continent ages quickly once we co
- Page 19 and 20:
Good NewsMore foodSupported alarger
- Page 22 and 23:
Figure 2-8 Theodore (“Teddy”)Ro
- Page 24:
What Happened during the 1970s? The
- Page 27 and 28:
on which they and their ancestors h
- Page 29 and 30:
Science is an adventure of the huma
- Page 31 and 32:
CTIONSWhat Is Harmingthe Robins?Sup
- Page 33 and 34:
After building and testing a mathem
- Page 35 and 36:
I am going to give you a brief intr
- Page 37 and 38:
Figure 3-6 The pH scale, used to me
- Page 39 and 40:
The different molecules of DNA that
- Page 41 and 42:
Energy emitted from sun (kcal/cm 2
- Page 43:
aluminum foil. When solid water (ic
- Page 46 and 47:
nn23592 UUranium-235nucleus9236Kr14
- Page 48 and 49:
SolarenergyChemicalenergy(photosynt
- Page 50 and 51:
number of resource users. In other
- Page 52 and 53:
The earth’s thin film of living m
- Page 54 and 55:
(a) Eukaryotic CellNucleus(informat
- Page 56 and 57:
AtmosphereVegetationBiosphereand an
- Page 58 and 59:
Coastal chaparraland scrubConiferou
- Page 60 and 61:
NoorganismsLower limitof toleranceF
- Page 62 and 63:
Detritus feedersDecomposersLong-hor
- Page 64 and 65:
First TrophicLevelSecond TrophicLev
- Page 66 and 67:
Figure 4-20 Generalized pyramid of
- Page 68 and 69:
Terrestrial EcosystemsSwamps and ma
- Page 70 and 71:
every handful of topsoil break down
- Page 72 and 73:
suited for plant growth. It has a t
- Page 74 and 75:
Figure 4-29 Naturalcapital: simplif
- Page 76 and 77:
wildlife habitats, alter temperatur
- Page 78 and 79:
miningFertilizerexcretionuptake bya
- Page 80 and 81:
How Are Human Activities Affecting
- Page 82 and 83:
For example, people visit degraded
- Page 84 and 85:
There is grandeur to this view of l
- Page 86 and 87:
According to the theory of evolutio
- Page 88 and 89:
Black skimmerseizes small fishat wa
- Page 90 and 91:
5-4 SPECIATION, EXTINCTION,AND BIOD
- Page 92 and 93:
Scientists have also identified per
- Page 94 and 95:
Identify and extractgene with desir
- Page 96 and 97:
infrared radiation, as a rattlesnak
- Page 98 and 99:
To do science is to search for repe
- Page 100 and 101:
figure. Scientists hypothesize that
- Page 102 and 103:
ArcticCircleTropic ofCancerNorth Pa
- Page 104 and 105:
Winds can also affect regionalclima
- Page 106 and 107:
FPO(a) Rays of sunlight penetrateth
- Page 108 and 109:
ColdPolarTundraSubpolarDecreasing t
- Page 110 and 111:
Figure 6-20 Natural capital:some co
- Page 112 and 113:
Beisa oryxCape buffaloWildebeestTop
- Page 114 and 115:
Figure 6-25 Natural capitaldegradat
- Page 116 and 117:
Natural Capital DegradationGrasslan
- Page 118 and 119:
4540HarpyeagleEmergentlayer35Tocoto
- Page 120 and 121:
with sunlight available only 6-8 ho
- Page 122 and 123:
Natural Capital DegradationWhen we
- Page 124 and 125: If there is magic on this planet, i
- Page 126 and 127: there. Photosynthesis cannot take p
- Page 128 and 129: Figure 7-7 View of an estuary taken
- Page 130 and 131: Rocky Shore BeachSea starHermit cra
- Page 132 and 133: Figure 7-12 Natural capital:some co
- Page 134 and 135: EcologicalServicesClimatemoderation
- Page 136 and 137: In warm months the bottom layer of
- Page 138 and 139: According to scientists, we urgentl
- Page 140 and 141: Animal and vegetable life is too co
- Page 142 and 143: HighHighHighRate of immigrationor e
- Page 144 and 145: mostly on land and eat insects that
- Page 146 and 147: According to this hypothesis, musse
- Page 148 and 149: Many people—influenced by movies
- Page 150 and 151: strychnine, peyote, nicotine, and r
- Page 152 and 153: It is tempting to think of mutualis
- Page 155 and 156: How Do Species Replace One Another
- Page 157 and 158: By contrast, grasslands are much le
- Page 159 and 160: 9Population EcologyPopulationContro
- Page 161 and 162: The size of a population that inclu
- Page 163 and 164: Number of reindeer2,0001,5001,00050
- Page 165 and 166: Reproductive individuals in populat
- Page 167 and 168: Percentage surviving (log scale)100
- Page 169 and 170: A third type of alteration is using
- Page 171 and 172: In the next chapter we will apply t
- Page 173: The problems to be faced are vast a
- Page 177 and 178: United States Mexico CanadaPopulati
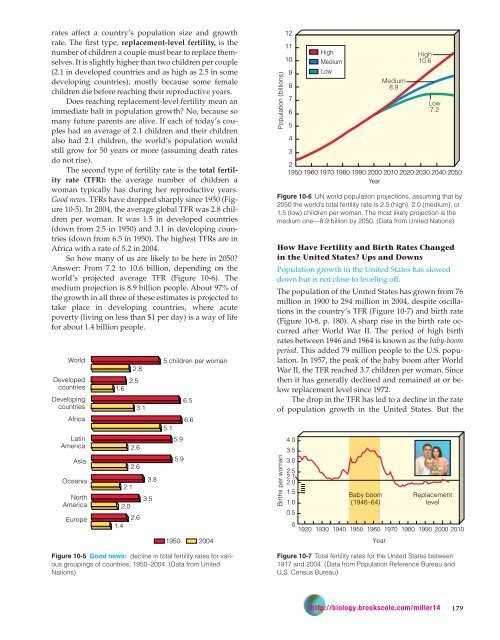
- Page 179 and 180: and a high incidence of infectious
- Page 181 and 182: Age100+95-9990-9485-8980-8475-7970-
- Page 183 and 184: Age Distribution (%)403530252015105
- Page 185 and 186: 80Stage 1PreindustrialStage 2Transi
- Page 187 and 188: also make up 70% of the world’s p
- Page 189 and 190: Such experience also suggests that
- Page 191 and 192: Forests precede civilizations, dese
- Page 193 and 194: The Species ApproachGoalProtect spe
- Page 195 and 196: parkways, trails, rivers, seashores
- Page 197 and 198: Weak treesremovedFigure 11-8 Short
- Page 199 and 200: AdvantagesHigher timberyieldsMaximu
- Page 201 and 202: trees no faster than they are reple
- Page 203 and 204: Sudden oak death White pine blister
- Page 205 and 206: vere forest fires for two reasons.
- Page 207 and 208: and degradation practices, Brazil
- Page 209 and 210: SolutionsSustaining Tropical Forest
- Page 211 and 212: • Integrate plans for managing pa
- Page 213 and 214: Should Reserves Be as Large as Poss
- Page 215 and 216: Figure 11-24 Endangered natural cap
- Page 217 and 218: ity of ecosystems well enough to re
- Page 219 and 220: original state? How much of it shou
- Page 221 and 222: The last word in ignorance is the p
- Page 223 and 224: Florida manatee Northern spotted ow
- Page 225 and 226:
each of these three species estimat
- Page 227 and 228:
BiophiliaBiologist EdwardO. Wilson
- Page 229 and 230:
Island species, many of them endemi
- Page 231 and 232:
Deliberately Introduced SpeciesPurp
- Page 233 and 234:
The Termite from HellForget killer
- Page 235 and 236:
© Karl Ammann. Biosynergy Institut
- Page 237 and 238:
tional Trade in Endangered Species
- Page 239 and 240:
Most people would say yes. The prob
- Page 241 and 242:
the act allows for economic concern
- Page 243 and 244:
ity, with the aim of reintroducing
- Page 245 and 246:
The Department of Defense controls
- Page 247 and 248:
13 SustainingAquatic BiodiversityBi
- Page 249 and 250:
CobiaHogfishKelpCarrageenPacific sa
- Page 251 and 252:
peated scraping. Slow-growing, long
- Page 253 and 254:
control approach and to be sure the
- Page 255 and 256:
(CITES), the 1979 Global Treaty on
- Page 257 and 258:
Beetle car, and some of its arterie
- Page 259 and 260:
What Role Can ReconciliationEcology
- Page 261 and 262:
eries. When it works, community-bas
- Page 263 and 264:
GULF OFMEXICOAgricultural areaTreat
- Page 265 and 266:
water withdrawal for irrigation. An
- Page 267 and 268:
SolutionsRebuilding Salmon Populati
- Page 269 and 270:
14 Foodand Soil ResourcesSoilBiodiv
- Page 271 and 272:
Industrialized agricultureShifting
- Page 273 and 274:
First green revolution(developed co
- Page 275 and 276:
Low-Tech Sustainable Agriculture in
- Page 277 and 278:
According to the U.S. Department of
- Page 279 and 280:
OvergrazingDeforestationErosionCaus
- Page 281 and 282:
(a) Terracing(b) Contour planting a
- Page 283 and 284:
2,000400Grain production(millions o
- Page 285 and 286:
People who are underfed and underwe
- Page 287 and 288:
14-6 INCREASING CROPPRODUCTIONWhat
- Page 289 and 290:
sistence farmers in developing coun
- Page 291 and 292:
capita meat production more than do
- Page 293 and 294:
A more expensive and less widely us
- Page 295 and 296:
Spotter airplaneFish farmingin cage
- Page 297 and 298:
estuaries. Then the fish are releas
- Page 299 and 300:
Currently, organic farming is used
- Page 301 and 302:
15 WaterResourcesWaterCASE STUDYWat
- Page 303 and 304:
physically connects us to one anoth
- Page 305 and 306:
Groundwater normally moves from poi
- Page 307 and 308:
and wildlife could trigger “water
- Page 309 and 310:
city’s water systems have been ta
- Page 311 and 312:
for the dams and reservoirs and has
- Page 313 and 314:
has devastated the area’s fishing
- Page 315 and 316:
Aquifers provide drinking water for
- Page 317 and 318:
WYOMINGCOLORADONEW MEXICOSOUTH DAKO
- Page 319 and 320:
Mohamed El-Ashry of the World Resou
- Page 321 and 322:
water waste by about 84% while irri
- Page 323 and 324:
15-8 TOO MUCH WATERWhat Causes Floo
- Page 325 and 326:
gradually. Another way to reduce fl
- Page 327 and 328:
16 MineralGeology and NonrenewableR
- Page 329 and 330:
AbyssalhillsAbyssalfloorOceanicridg
- Page 331 and 332:
usually rides up over the denser oc
- Page 333 and 334:
cant (less than 4.0 on the Richter
- Page 335 and 336:
ported from their sources by water,
- Page 337 and 338:
How Are Buried Mineral DepositsRemo
- Page 339 and 340:
16-6 ENVIRONMENTAL EFFECTSOF USING
- Page 341 and 342:
Separationof ore fromgangueMetal or
- Page 343 and 344:
Some analysts contend that all we n
- Page 345 and 346:
Can We Find Substitutes for ScarceN
- Page 347 and 348:
Typical citizens of advanced indust
- Page 349 and 350:
Figure 17-5 shows energy consumptio
- Page 351 and 352:
Currently, oil has a high net energ
- Page 353 and 354:
ArcticOceanCoalPrince WilliamSoundG
- Page 355 and 356:
Oil (million barrels per day)120100
- Page 357 and 358:
Coal-firedelectricitySynthetic oil
- Page 359 and 360:
Burning natural gas emits CO 2 but
- Page 361 and 362:
Trade-OffsCoalxHOW WOULD YOU VOTE?
- Page 363 and 364:
Small amounts ofradioactive gasesUr
- Page 365 and 366:
After more than 50 years of develop
- Page 367 and 368:
CoalAmple supplyHigh net energyyiel
- Page 369 and 370:
corrode and release their radioacti
- Page 371 and 372:
out the entire rail or truck trip i
- Page 373 and 374:
manently in 1998. Because of this e
- Page 375 and 376:
18 andEnergy EfficiencyRenewable En
- Page 377 and 378:
Energy Inputs System Outputs86%8%3%
- Page 379 and 380:
source. These systems have an energ
- Page 381 and 382:
ABCombustion engine:Small, efficien
- Page 383 and 384:
Atlanta’s 13-story Georgia Power
- Page 385 and 386:
Net Energy EfficiencySuperinsulated
- Page 387 and 388:
Why Are We Still Wasting So Much En
- Page 389 and 390:
How Can We Cool Houses Naturally? I
- Page 391 and 392:
AdvantagesFairly high netenergyWork
- Page 393 and 394:
The DOE calls the Great Plains stat
- Page 395 and 396:
AdvantagesLarge potentialsupply in
- Page 397 and 398:
surface. Researchers in several cou
- Page 399 and 400:
Primary EnergySourcesHydrogenProduc
- Page 401 and 402:
Bioenergy power plantsWind farmSmal
- Page 403 and 404:
Nuclear energy(fission and fusion)$
- Page 405 and 406:
19 andRisk, Toxicology,Human Health
- Page 407 and 408:
Number of individuals affectedVerys
- Page 409 and 410:
How Can We Estimate the Toxicity of
- Page 411 and 412:
dosage. With the threshold dose-res
- Page 413 and 414:
HormoneEstrogenlike chemicalAntiand
- Page 415 and 416:
19-4 BIOLOGICAL HAZARDS:DISEASE IN
- Page 417 and 418:
A typical virus consists of a shell
- Page 419 and 420:
For example, the West Nile virus ha
- Page 421 and 422:
eggs4. Parasite invadesblood cells,
- Page 423 and 424:
AgentContagiousSymptomsMortality(if
- Page 425 and 426:
Cause of DeathAnnual DeathsPoverty/
- Page 427 and 428:
■ How should limited funds be spe
- Page 429 and 430:
20 AirPollutionAirPopulationPolluti
- Page 431 and 432:
layer of rising and falling air cur
- Page 433 and 434:
Air Pollution in the Past: The Bad
- Page 435 and 436:
tems, most scientists say that it m
- Page 437 and 438:
UltrafineParticlesSea salt nucleiFi
- Page 439 and 440:
Warmer airInversion layerIncreasing
- Page 441 and 442:
4.75.45.14.75.25.35.35.55.95.54.75.
- Page 443 and 444:
when the soil pH falls below 5.1. E
- Page 445 and 446:
educe or eliminate emissions of SO
- Page 447 and 448:
FurnaceSlabSoilClothesdryerRadon-22
- Page 449 and 450:
How Many People Die Prematurely fro
- Page 451 and 452:
plant expansions, or sell them to o
- Page 453 and 454:
Cleaned gasElectrodesCleaned gasDir
- Page 455 and 456:
PreventionCover ceiling tilesand li
- Page 457 and 458:
21 andClimate ChangeOzone LossClima
- Page 459 and 460:
Average surface temperature (°C)Av
- Page 461 and 462:
380410Concentration of carbon dioxi
- Page 463 and 464:
Table 21-2 Major Characteristics of
- Page 465 and 466:
are dying because the permafrost un
- Page 467 and 468:
CellCloudsLandOceanAccording to the
- Page 469 and 470:
They suggest that this indicates th
- Page 471 and 472:
Agriculture• Shifts in food-growi
- Page 473 and 474:
ter temperatures in the Sierra Neva
- Page 475 and 476:
PreventionCut fossil fueluse (espec
- Page 477 and 478:
taxes on carbon emissions or fuel u
- Page 479 and 480:
What Can You Do?Reducing CO 2 Emiss
- Page 481 and 482:
Ultraviolet light hits a chlorofluo
- Page 483 and 484:
ozone in the stratosphere. From a h
- Page 485 and 486:
Abundance (parts per trillion)INDIV
- Page 487 and 488:
22 WaterPollutionWaterPollutionCont
- Page 489 and 490:
Table 22-2 Common Diseases Transmit
- Page 491 and 492:
Because point sources are at specif
- Page 493 and 494:
veloped countries. Two causes of th
- Page 495 and 496:
Nitrogen compoundsproduced by carsa
- Page 497 and 498:
ties of acids, pesticides, and othe
- Page 499 and 500:
ern India drink groundwater contami
- Page 501 and 502:
100 kilometers (62 miles) of the co
- Page 503 and 504:
Dumping industrial waste off U.S. c
- Page 505 and 506:
The key to protecting oceans is to
- Page 507 and 508:
PrimarySecondaryGritBar screen cham
- Page 509 and 510:
where bacteria break down remaining
- Page 511 and 512:
Officials are working to find ways
- Page 513 and 514:
It is a hard truth to swallow, but
- Page 515 and 516:
A weed is a plant whose virtues hav
- Page 517 and 518:
veloped countries, but use in devel
- Page 519 and 520:
U.S. Department of Agricultureresis
- Page 521 and 522:
What Goes Around CanCome AroundU.S.
- Page 523 and 524:
our bodies, and we should be concer
- Page 525 and 526:
U.S. Department of AgricultureAgric
- Page 527 and 528:
and opposition from agricultural ch
- Page 529 and 530:
Solid wastes are only raw materials
- Page 531 and 532:
24-2 PRODUCING LESS WASTEWhat Are O
- Page 533 and 534:
PharmaceuticalplantSludgeLocal farm
- Page 535 and 536:
matter and energy resources, cuts p
- Page 537 and 538:
Reduces globalwarmingReduces acidde
- Page 539 and 540:
xHOW WOULD YOU VOTE? Should househo
- Page 541 and 542:
Disposalwaste, pollutionUsebleach,d
- Page 543 and 544:
What Are the Advantages and Disadva
- Page 545 and 546:
What Harmful Chemicals Are in Your
- Page 547 and 548:
icals. Scientists are testing the u
- Page 549 and 550:
Most hazardous waste in the United
- Page 551 and 552:
PreventionPhase out leadedgasoline
- Page 553 and 554:
EPA advised women who may become pr
- Page 555 and 556:
When they can be found, responsible
- Page 557 and 558:
out use of these chemicals and to d
- Page 559 and 560:
25 SustainableCitiesBiodiversityEne
- Page 561 and 562:
Karachi10.4 million16.2 millionDhak
- Page 563 and 564:
Image provided courtesy of theU.S.
- Page 565 and 566:
InputsOutputsEnergyFoodWaterRawmate
- Page 567 and 568:
Despite joblessness, squalor, overc
- Page 569 and 570:
day—and injure another 15 million
- Page 571 and 572:
T rade-OffsMass Transit RailT rade-
- Page 573 and 574:
area (Figure 25-7) between 1862 and
- Page 575 and 576:
MajorhighwaysGreenbeltUrban centerS
- Page 577 and 578:
powered motorcycles by 2007, and is
- Page 579 and 580:
26 andEconomics, Environment,Sustai
- Page 581 and 582:
price matches what buyers are willi
- Page 583 and 584:
SunEARTHFigure 26-4 Ecological econ
- Page 585 and 586:
CostHighLowOptimum pollutionclean-u
- Page 587 and 588:
onment, their flow rates through th
- Page 589 and 590:
cluding costs, as much as possible,
- Page 591 and 592:
• Decreases depletion and degrada
- Page 593 and 594:
Should We Rely More on Tradable Pol
- Page 595 and 596:
Figure 26-14 Data on the global dis
- Page 597 and 598:
Microloans to the PoorMost of thewo
- Page 599 and 600:
Sunset BusinessesCoal miningOil pro
- Page 601 and 602:
27 andPolitics, Environment,Sustain
- Page 603 and 604:
ness, and environmental leaders and
- Page 605 and 606:
Leaders are persons whom other peop
- Page 607 and 608:
issue as the key to making governme
- Page 609 and 610:
LobbyistsLobbyistsLawmaking bodyPub
- Page 611 and 612:
19691970197119721973197419751976197
- Page 613 and 614:
noise to certain levels or to elimi
- Page 615 and 616:
The spearhead of the global conserv
- Page 617 and 618:
Such audits have resulted in numero
- Page 619 and 620:
natural capital. According to envir
- Page 621 and 622:
Speth and several other national an
- Page 623 and 624:
■ Open all discussions and findin
- Page 625 and 626:
7. Explain why you agree or disagre
- Page 627 and 628:
The main ingredients of an environm
- Page 629 and 630:
global economy with minimal governm
- Page 631 and 632:
What Is the Environmental WisdomWor
- Page 633 and 634:
onmental education. They cite some
- Page 635 and 636:
What Are Our Basic Needs?Obviously,
- Page 637 and 638:
new relationship with the earth tha
- Page 639 and 640:
APPENDIX 1UNITS OF MEASURELENGTHMet
- Page 641 and 642:
1930s 1940s 1950s1938 Federal Food,
- Page 643 and 644:
1970s1971Biologist BarryCommonerpub
- Page 645 and 646:
1991-2000Continuing efforts by anti
- Page 647 and 648:
OHcommon covalent compounds, formed
- Page 649 and 650:
A PPENDIX 4CLASSIFYING AND NAMING S
- Page 651 and 652:
GLOSSARYabiotic Nonliving. Compare
- Page 653 and 654:
CFCsSee chlorofluorocarbons.chain r
- Page 655 and 656:
timeters (10 inches) a year. Such a
- Page 657 and 658:
eutrophication Physical, chemical,
- Page 659 and 660:
high-throughput economy The situati
- Page 661 and 662:
distribution facilities. Compare hu
- Page 663 and 664:
and with atoms of one or more other
- Page 665 and 666:
adioactive decay Change of a radioi
- Page 667 and 668:
soil permeability Rate at which wat
- Page 669:
transmissible disease A disease tha