Statement of Assets and Liabilities for last Five Years and Latest ...
Statement of Assets and Liabilities for last Five Years and Latest ...
Statement of Assets and Liabilities for last Five Years and Latest ...

Create successful ePaper yourself
Turn your PDF publications into a flip-book with our unique Google optimized e-Paper software.
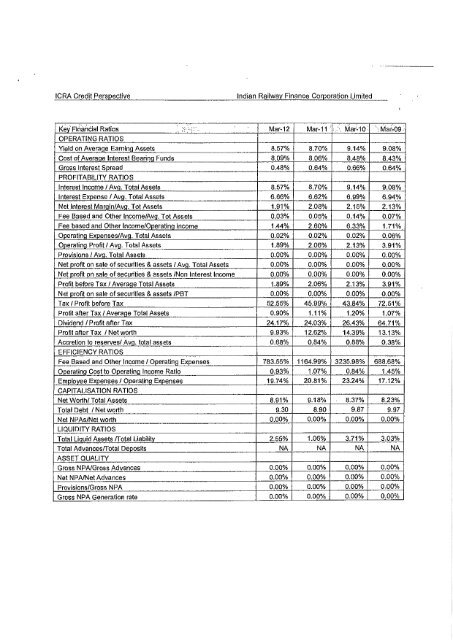
ICRA Credit PerspectiveIndian Railwa}' Finance Corporation LimitedKe•/ FinanCial Ratios . :,1:: ;..:··· Mar-12 Mar-11 ' .. Mar~10 • ·'. Mat~09·•OPERATING RATIOSYield on Average Eaming <strong>Assets</strong> 8.57% 8.70% 9.14% 9.08%Cost <strong>of</strong> Averaqe Interest BearinQ Funds 8.09% 8.06% 8.48% 8.43%Gross Interest Spread 0.48% 0.64% 0.66% 0.64%PROFITABILITY RATIOSInterest Income I Avg. Total <strong>Assets</strong> 8.57% 8.70% 9.14% 9.08%Interest Expense I Avg. Total <strong>Assets</strong> 6.66% 6.62% 6.99% 6.94%Net Interest MarqiniAvq. Tot <strong>Assets</strong> 1.91% 2.08% 2.15% 2.13%Fee Based <strong>and</strong> Other lncomeiAvg. Tot <strong>Assets</strong> 0.03% 0.05% 0.14% 0.07%Fee based <strong>and</strong> Other lncomeiOperatlnQ Income 1.44% 2.60% 6.33% 1.71%Op_eratin11 Expenses/Av~. Total <strong>Assets</strong> 0.02% 0.02% 0.02% 0.06%Operating Pr<strong>of</strong>itt Avq. Total <strong>Assets</strong> 1.89% 2.06% 2.13% 3.91%Provisions I Avq. Total <strong>Assets</strong> 0.00% 0.00% 0.00% 0.00%Net pr<strong>of</strong>it on sale <strong>of</strong> securities & assets I Ava. Total <strong>Assets</strong> 0.00% 0.00% 0.00% 0.00%Net pr<strong>of</strong>it on sale <strong>of</strong> securities & assets /Non Interest Income 0.00% 0.00% 0.00% 0.00%Pr<strong>of</strong>it be<strong>for</strong>e Tax I Average Total <strong>Assets</strong> 1.89% 2.06% 2.13% 3.91%Net pr<strong>of</strong>it on sale <strong>of</strong> securities & assets IPBT 0.00% 0.00% 0.00% 0.00%Tax I Pr<strong>of</strong>it be<strong>for</strong>e Tax 52.55% 45.99% 43.84% 72.51%Pr<strong>of</strong>it after Tax I Average Total <strong>Assets</strong> 0.90% 1.11% 1.20% 1.07%Dividend I Pr<strong>of</strong>it after Tax 24.17% 24.03% 26.43% 64.71%Pr<strong>of</strong>it after Tax I Net worth 9.93% 12.62% 14.39% 13.13%Accretion to rese!Ves/ Avq. total assets 0.68% 0.84% 0.88% 0.38%EFFICIENCY RATIOSFee Based <strong>and</strong> Other Income I Operating Expenses 783.55% 1164.99% 3235.98% 688.68%Ooerating Cost to OoeraHna Income Ratio 0.93% 1.07% 0.84% 1.45%Emplovee Expenses I Operating Expenses 19.74% 20.81% 23.24% 17.12%CAPITALISATION RATIOSNet Worth/ Total <strong>Assets</strong> 8.91% 9.18% 8.37% 8.23%Total Debt I Net worth 9.30 8.90 9.87 9.97Net NPAs/Net worth 0.00% 0.00% 0.00% 0.00%LIQUIDITY RATIOSTotal Liquid <strong>Assets</strong> /Total Liability 2.55% 1.06% 3.71% 3.03%Total Advances/Total Deposits NA NA NA NAASSET QUALITYGross NPA/Gross Advances 0.00% 0.00% 0.00% 0.00%Net NPAINet Advances 0.00% 0.00% 0.00% 0.00%Provisions/Gross NPA 0.00% 0.00% 0.00% 0.00%Gross NPA Generation rate 0.00% 0.00% 0.00% 0.00%