

Applied numerical modeling of saturated / unsaturated flow and ...
Applied numerical modeling of saturated / unsaturated flow and ...
Applied numerical modeling of saturated / unsaturated flow and ...

Create successful ePaper yourself
Turn your PDF publications into a flip-book with our unique Google optimized e-Paper software.
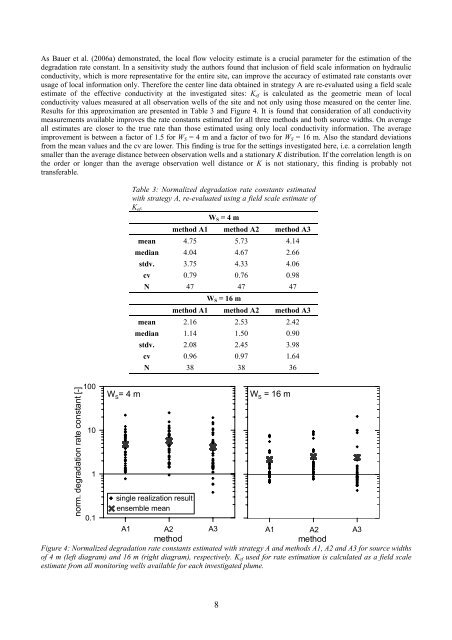
As Bauer et al. (2006a) demonstrated, the local <strong>flow</strong> velocity estimate is a crucial parameter for the estimation <strong>of</strong> the<br />
degradation rate constant. In a sensitivity study the authors found that inclusion <strong>of</strong> field scale information on hydraulic<br />
conductivity, which is more representative for the entire site, can improve the accuracy <strong>of</strong> estimated rate constants over<br />
usage <strong>of</strong> local information only. Therefore the center line data obtained in strategy A are re-evaluated using a field scale<br />
estimate <strong>of</strong> the effective conductivity at the investigated sites: Kef is calculated as the geometric mean <strong>of</strong> local<br />
conductivity values measured at all observation wells <strong>of</strong> the site <strong>and</strong> not only using those measured on the center line.<br />
Results for this approximation are presented in Table 3 <strong>and</strong> Figure 4. It is found that consideration <strong>of</strong> all conductivity<br />
measurements available improves the rate constants estimated for all three methods <strong>and</strong> both source widths. On average<br />
all estimates are closer to the true rate than those estimated using only local conductivity information. The average<br />
improvement is between a factor <strong>of</strong> 1.5 for WS = 4 m <strong>and</strong> a factor <strong>of</strong> two for WS = 16 m. Also the st<strong>and</strong>ard deviations<br />
from the mean values <strong>and</strong> the cv are lower. This finding is true for the settings investigated here, i.e. a correlation length<br />
smaller than the average distance between observation wells <strong>and</strong> a stationary K distribution. If the correlation length is on<br />
the order or longer than the average observation well distance or K is not stationary, this finding is probably not<br />
transferable.<br />
norm. degradation rate constant [-]<br />
100<br />
10<br />
1<br />
0.1<br />
Table 3: Normalized degradation rate constants estimated<br />
with strategy A, re-evaluated using a field scale estimate <strong>of</strong><br />
Kef.<br />
WS = 4 m<br />
method A1 method A2 method A3<br />
mean 4.75 5.73 4.14<br />
median 4.04 4.67 2.66<br />
stdv. 3.75 4.33 4.06<br />
cv 0.79 0.76 0.98<br />
N 47 47 47<br />
WS = 16 m<br />
method A1 method A2 method A3<br />
mean 2.16 2.53 2.42<br />
median 1.14 1.50 0.90<br />
stdv. 2.08 2.45 3.98<br />
cv 0.96 0.97 1.64<br />
N 38 38 36<br />
W S= 4 m W S = 16 m<br />
single realization result<br />
ensemble mean<br />
A1 1 A2 2 A3 3<br />
A1 1 A2 2 A3 3<br />
method<br />
method<br />
Figure 4: Normalized degradation rate constants estimated with strategy A <strong>and</strong> methods A1, A2 <strong>and</strong> A3 for source widths<br />
<strong>of</strong> 4 m (left diagram) <strong>and</strong> 16 m (right diagram), respectively. Kef used for rate estimation is calculated as a field scale<br />
estimate from all monitoring wells available for each investigated plume.<br />
8


