

Applied numerical modeling of saturated / unsaturated flow and ...
Applied numerical modeling of saturated / unsaturated flow and ...
Applied numerical modeling of saturated / unsaturated flow and ...

Create successful ePaper yourself
Turn your PDF publications into a flip-book with our unique Google optimized e-Paper software.
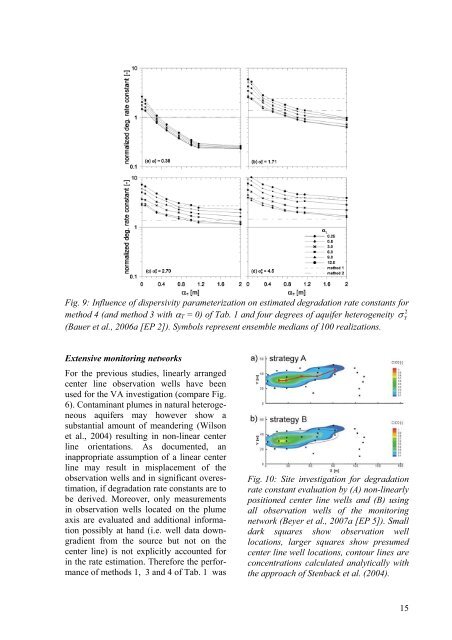
Fig. 9: Influence <strong>of</strong> dispersivity parameterization on estimated degradation rate constants for<br />
2<br />
method 4 (<strong>and</strong> method 3 with �T = 0) <strong>of</strong> Tab. 1 <strong>and</strong> four degrees <strong>of</strong> aquifer heterogeneity � Y<br />
(Bauer et al., 2006a [EP 2]). Symbols represent ensemble medians <strong>of</strong> 100 realizations.<br />
Extensive monitoring networks<br />
For the previous studies, linearly arranged<br />
center line observation wells have been<br />
used for the VA investigation (compare Fig.<br />
6). Contaminant plumes in natural heterogeneous<br />
aquifers may however show a<br />
substantial amount <strong>of</strong> me<strong>and</strong>ering (Wilson<br />
et al., 2004) resulting in non-linear center<br />
line orientations. As documented, an<br />
inappropriate assumption <strong>of</strong> a linear center<br />
line may result in misplacement <strong>of</strong> the<br />
observation wells <strong>and</strong> in significant overestimation,<br />
if degradation rate constants are to<br />
be derived. Moreover, only measurements<br />
in observation wells located on the plume<br />
axis are evaluated <strong>and</strong> additional information<br />
possibly at h<strong>and</strong> (i.e. well data downgradient<br />
from the source but not on the<br />
center line) is not explicitly accounted for<br />
in the rate estimation. Therefore the performance<br />
<strong>of</strong> methods 1, 3 <strong>and</strong> 4 <strong>of</strong> Tab. 1 was<br />
Fig. 10: Site investigation for degradation<br />
rate constant evaluation by (A) non-linearly<br />
positioned center line wells <strong>and</strong> (B) using<br />
all observation wells <strong>of</strong> the monitoring<br />
network (Beyer et al., 2007a [EP 5]). Small<br />
dark squares show observation well<br />
locations, larger squares show presumed<br />
center line well locations, contour lines are<br />
concentrations calculated analytically with<br />
the approach <strong>of</strong> Stenback et al. (2004).<br />
15


