

Applied numerical modeling of saturated / unsaturated flow and ...
Applied numerical modeling of saturated / unsaturated flow and ...
Applied numerical modeling of saturated / unsaturated flow and ...

Create successful ePaper yourself
Turn your PDF publications into a flip-book with our unique Google optimized e-Paper software.
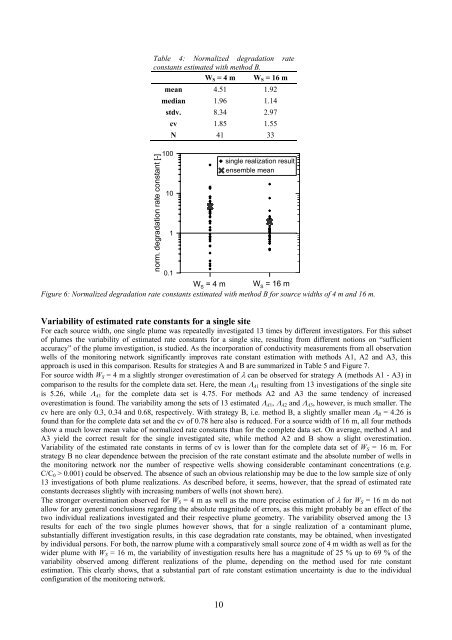
Table 4: Normalized degradation rate<br />
constants estimated with method B.<br />
WS = 4 m WS = 16 m<br />
mean 4.51 1.92<br />
median 1.96 1.14<br />
stdv. 8.34 2.97<br />
cv 1.85 1.55<br />
N 41 33<br />
norm. degradation rate constant [-]<br />
100<br />
10<br />
1<br />
0.1<br />
WS = 4 m WS = 16 m<br />
Figure 6: Normalized degradation rate constants estimated with method B for source widths <strong>of</strong> 4 m <strong>and</strong> 16 m.<br />
10<br />
single realization result<br />
ensemble mean<br />
Variability <strong>of</strong> estimated rate constants for a single site<br />
For each source width, one single plume was repeatedly investigated 13 times by different investigators. For this subset<br />
<strong>of</strong> plumes the variability <strong>of</strong> estimated rate constants for a single site, resulting from different notions on “sufficient<br />
accuracy” <strong>of</strong> the plume investigation, is studied. As the incorporation <strong>of</strong> conductivity measurements from all observation<br />
wells <strong>of</strong> the monitoring network significantly improves rate constant estimation with methods A1, A2 <strong>and</strong> A3, this<br />
approach is used in this comparison. Results for strategies A <strong>and</strong> B are summarized in Table 5 <strong>and</strong> Figure 7.<br />
For source width WS = 4 m a slightly stronger overestimation <strong>of</strong> λ can be observed for strategy A (methods A1 - A3) in<br />
comparison to the results for the complete data set. Here, the mean ΛA1 resulting from 13 investigations <strong>of</strong> the single site<br />
is 5.26, while ΛA1 for the complete data set is 4.75. For methods A2 <strong>and</strong> A3 the same tendency <strong>of</strong> increased<br />
overestimation is found. The variability among the sets <strong>of</strong> 13 estimated ΛA1, ΛA2 <strong>and</strong> ΛA3, however, is much smaller. The<br />
cv here are only 0.3, 0.34 <strong>and</strong> 0.68, respectively. With strategy B, i.e. method B, a slightly smaller mean ΛB = 4.26 is<br />
found than for the complete data set <strong>and</strong> the cv <strong>of</strong> 0.78 here also is reduced. For a source width <strong>of</strong> 16 m, all four methods<br />
show a much lower mean value <strong>of</strong> normalized rate constants than for the complete data set. On average, method A1 <strong>and</strong><br />
A3 yield the correct result for the single investigated site, while method A2 <strong>and</strong> B show a slight overestimation.<br />
Variability <strong>of</strong> the estimated rate constants in terms <strong>of</strong> cv is lower than for the complete data set <strong>of</strong> WS = 16 m. For<br />
strategy B no clear dependence between the precision <strong>of</strong> the rate constant estimate <strong>and</strong> the absolute number <strong>of</strong> wells in<br />
the monitoring network nor the number <strong>of</strong> respective wells showing considerable contaminant concentrations (e.g.<br />
C/C0 > 0.001) could be observed. The absence <strong>of</strong> such an obvious relationship may be due to the low sample size <strong>of</strong> only<br />
13 investigations <strong>of</strong> both plume realizations. As described before, it seems, however, that the spread <strong>of</strong> estimated rate<br />
constants decreases slightly with increasing numbers <strong>of</strong> wells (not shown here).<br />
The stronger overestimation observed for WS = 4 m as well as the more precise estimation <strong>of</strong> λ for WS = 16 m do not<br />
allow for any general conclusions regarding the absolute magnitude <strong>of</strong> errors, as this might probably be an effect <strong>of</strong> the<br />
two individual realizations investigated <strong>and</strong> their respective plume geometry. The variability observed among the 13<br />
results for each <strong>of</strong> the two single plumes however shows, that for a single realization <strong>of</strong> a contaminant plume,<br />
substantially different investigation results, in this case degradation rate constants, may be obtained, when investigated<br />
by individual persons. For both, the narrow plume with a comparatively small source zone <strong>of</strong> 4 m width as well as for the<br />
wider plume with WS = 16 m, the variability <strong>of</strong> investigation results here has a magnitude <strong>of</strong> 25 % up to 69 % <strong>of</strong> the<br />
variability observed among different realizations <strong>of</strong> the plume, depending on the method used for rate constant<br />
estimation. This clearly shows, that a substantial part <strong>of</strong> rate constant estimation uncertainty is due to the individual<br />
configuration <strong>of</strong> the monitoring network.


