

Applied numerical modeling of saturated / unsaturated flow and ...
Applied numerical modeling of saturated / unsaturated flow and ...
Applied numerical modeling of saturated / unsaturated flow and ...

Create successful ePaper yourself
Turn your PDF publications into a flip-book with our unique Google optimized e-Paper software.
norm. degradation rate constant [-]<br />
100<br />
10<br />
1<br />
0.1<br />
W S = 4 m W S = 16 m<br />
single realization result<br />
ensemble mean<br />
A1 1 A2 2 A3 3 4B<br />
A1 1 A2 2 A3 3 4B<br />
method<br />
method<br />
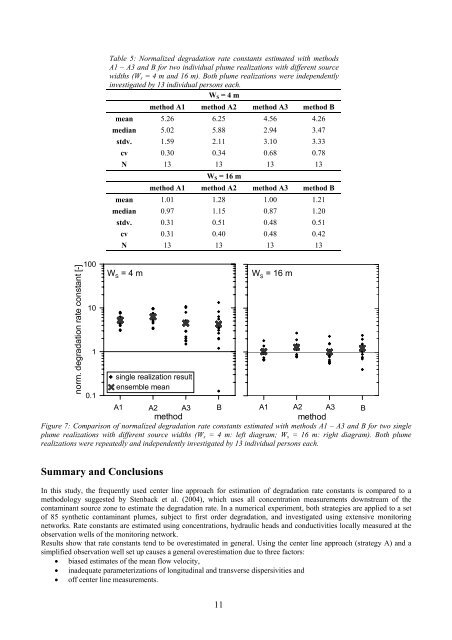
Figure 7: Comparison <strong>of</strong> normalized degradation rate constants estimated with methods A1 – A3 <strong>and</strong> B for two single<br />
plume realizations with different source widths (Ws = 4 m: left diagram; Ws = 16 m: right diagram). Both plume<br />
realizations were repeatedly <strong>and</strong> independently investigated by 13 individual persons each.<br />
Summary <strong>and</strong> Conclusions<br />
Table 5: Normalized degradation rate constants estimated with methods<br />
A1 – A3 <strong>and</strong> B for two individual plume realizations with different source<br />
widths (Ws = 4 m <strong>and</strong> 16 m). Both plume realizations were independently<br />
investigated by 13 individual persons each.<br />
WS = 4 m<br />
method A1 method A2 method A3 method B<br />
mean 5.26 6.25 4.56 4.26<br />
median 5.02 5.88 2.94 3.47<br />
stdv. 1.59 2.11 3.10 3.33<br />
cv 0.30 0.34 0.68 0.78<br />
N 13 13 13 13<br />
WS = 16 m<br />
method A1 method A2 method A3 method B<br />
mean 1.01 1.28 1.00 1.21<br />
median 0.97 1.15 0.87 1.20<br />
stdv. 0.31 0.51 0.48 0.51<br />
cv 0.31 0.40 0.48 0.42<br />
N 13 13 13 13<br />
In this study, the frequently used center line approach for estimation <strong>of</strong> degradation rate constants is compared to a<br />
methodology suggested by Stenback et al. (2004), which uses all concentration measurements downstream <strong>of</strong> the<br />
contaminant source zone to estimate the degradation rate. In a <strong>numerical</strong> experiment, both strategies are applied to a set<br />
<strong>of</strong> 85 synthetic contaminant plumes, subject to first order degradation, <strong>and</strong> investigated using extensive monitoring<br />
networks. Rate constants are estimated using concentrations, hydraulic heads <strong>and</strong> conductivities locally measured at the<br />
observation wells <strong>of</strong> the monitoring network.<br />
Results show that rate constants tend to be overestimated in general. Using the center line approach (strategy A) <strong>and</strong> a<br />
simplified observation well set up causes a general overestimation due to three factors:<br />
• biased estimates <strong>of</strong> the mean <strong>flow</strong> velocity,<br />
• inadequate parameterizations <strong>of</strong> longitudinal <strong>and</strong> transverse dispersivities <strong>and</strong><br />
• <strong>of</strong>f center line measurements.<br />
11


