

Applied numerical modeling of saturated / unsaturated flow and ...
Applied numerical modeling of saturated / unsaturated flow and ...
Applied numerical modeling of saturated / unsaturated flow and ...

You also want an ePaper? Increase the reach of your titles
YUMPU automatically turns print PDFs into web optimized ePapers that Google loves.
1.3m<br />
0.3m<br />
as a representative for highly soluble salts,<br />
naphthalene for moderately sorbing <strong>and</strong><br />
phenanthrene for strongly sorbing organic<br />
compounds. Contaminant leaching from the<br />
DW to the groundwater surface is studied<br />
with six different characteristic subsoil<br />
units <strong>of</strong> Germany (BGR, 2006) to be able to<br />
compare the influence <strong>of</strong> hydraulic <strong>and</strong><br />
basic physico-chemical soil properties on<br />
contaminant attenuation. Fig. 14 presents<br />
the conceptual model for the road dam.<br />
Here coarse grained DW is used as unbound<br />
base / subbase layers below the<br />
asphalt surface <strong>of</strong> the road. According to<br />
German road construction regulations, the<br />
base / subbase layers are covered by low<br />
<strong>and</strong> high permeable soil layers along the<br />
embankment (Fig. 14).<br />
RCB<br />
Körnung 0/32<br />
b horizon<br />
c horizon<br />
symmetry axis<br />
10m 1.5m<br />
asphalt layer<br />
impermeable low permeable soil<br />
3%<br />
4%<br />
12%<br />
1:1. 5<br />
2.3m<br />
10 cm high<br />
permeable soil<br />
2m<br />
groundwater surface<br />
(point <strong>of</strong> compliance)<br />
Fig. 14: Road construction with demolition<br />
waste recycled in base / subbase layers<br />
(Beyer et al., 2007b [EP 6]).<br />
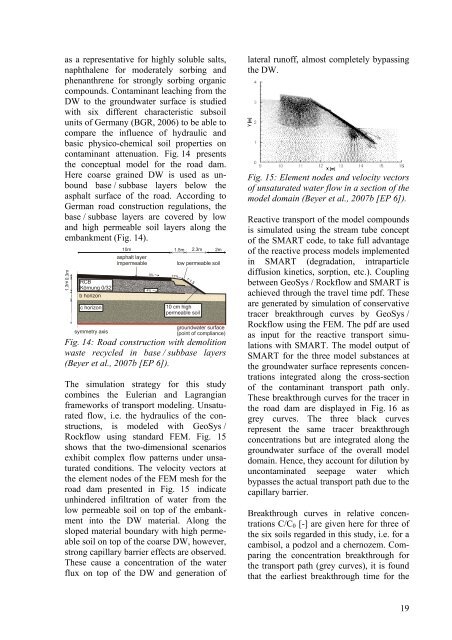
The simulation strategy for this study<br />
combines the Eulerian <strong>and</strong> Lagrangian<br />
frameworks <strong>of</strong> transport <strong>modeling</strong>. Un<strong>saturated</strong><br />
<strong>flow</strong>, i.e. the hydraulics <strong>of</strong> the constructions,<br />
is modeled with GeoSys /<br />
Rock<strong>flow</strong> using st<strong>and</strong>ard FEM. Fig. 15<br />
shows that the two-dimensional scenarios<br />
exhibit complex <strong>flow</strong> patterns under un<strong>saturated</strong><br />
conditions. The velocity vectors at<br />
the element nodes <strong>of</strong> the FEM mesh for the<br />
road dam presented in Fig. 15 indicate<br />
unhindered infiltration <strong>of</strong> water from the<br />
low permeable soil on top <strong>of</strong> the embankment<br />
into the DW material. Along the<br />
sloped material boundary with high permeable<br />
soil on top <strong>of</strong> the coarse DW, however,<br />
strong capillary barrier effects are observed.<br />
These cause a concentration <strong>of</strong> the water<br />
flux on top <strong>of</strong> the DW <strong>and</strong> generation <strong>of</strong><br />
lateral run<strong>of</strong>f, almost completely bypassing<br />
the DW.<br />
Fig. 15: Element nodes <strong>and</strong> velocity vectors<br />
<strong>of</strong> un<strong>saturated</strong> water <strong>flow</strong> in a section <strong>of</strong> the<br />
model domain (Beyer et al., 2007b [EP 6]).<br />
Reactive transport <strong>of</strong> the model compounds<br />
is simulated using the stream tube concept<br />
<strong>of</strong> the SMART code, to take full advantage<br />
<strong>of</strong> the reactive process models implemented<br />
in SMART (degradation, intraparticle<br />
diffusion kinetics, sorption, etc.). Coupling<br />
between GeoSys / Rock<strong>flow</strong> <strong>and</strong> SMART is<br />
achieved through the travel time pdf. These<br />
are generated by simulation <strong>of</strong> conservative<br />
tracer breakthrough curves by GeoSys /<br />
Rock<strong>flow</strong> using the FEM. The pdf are used<br />
as input for the reactive transport simulations<br />
with SMART. The model output <strong>of</strong><br />
SMART for the three model substances at<br />
the groundwater surface represents concentrations<br />
integrated along the cross-section<br />
<strong>of</strong> the contaminant transport path only.<br />
These breakthrough curves for the tracer in<br />
the road dam are displayed in Fig. 16 as<br />
grey curves. The three black curves<br />
represent the same tracer breakthrough<br />
concentrations but are integrated along the<br />
groundwater surface <strong>of</strong> the overall model<br />
domain. Hence, they account for dilution by<br />
uncontaminated seepage water which<br />
bypasses the actual transport path due to the<br />
capillary barrier.<br />
Breakthrough curves in relative concentrations<br />
C/C0 [-] are given here for three <strong>of</strong><br />
the six soils regarded in this study, i.e. for a<br />
cambisol, a podzol <strong>and</strong> a chernozem. Comparing<br />
the concentration breakthrough for<br />
the transport path (grey curves), it is found<br />
that the earliest breakthrough time for the<br />
19


