Applied numerical modeling of saturated / unsaturated flow and ...
Applied numerical modeling of saturated / unsaturated flow and ...
Applied numerical modeling of saturated / unsaturated flow and ...
You also want an ePaper? Increase the reach of your titles
YUMPU automatically turns print PDFs into web optimized ePapers that Google loves.
C. Beyer et al. / Journal <strong>of</strong> Contaminant Hydrology 87 (2006) 73–95<br />
medians. Only for L4 plume length overestimation is observed <strong>and</strong> uncertainty is increased in<br />
comparison to case A.<br />
6.3. Case C: estimation <strong>of</strong> Michaelis–Menten kinetics parameters <strong>and</strong> plume lengths for plumes<br />
following Michaelis–Menten degradation kinetics<br />
6.3.1. Estimation <strong>of</strong> rate parameters<br />
As demonstrated in case B, using a first order kinetics approximation for plumes following MM<br />
degradation kinetics introduces an additional error, yielding less conservative estimates <strong>of</strong> plume<br />
lengths (L1−L3) as well as higher uncertainty (L4). Therefore, method 5 for the estimation <strong>of</strong> the<br />
MM parameters is tested by application to the contaminant plumes following MM degradation<br />
kinetics (see Table 1). Using the same concentration vs. distance data as in Section 6.2, MM<br />
parameters kmax <strong>and</strong> MC are estimated by a linear fit as explained in Section 4.1. These parameters<br />
then are used to calculate the length <strong>of</strong> the contaminant plumes LMM by equation (10) (Table 3).<br />
Fig. 6 presents the results <strong>of</strong> the parameter estimation in single diagrams for each σ Y 2 (results<br />
for single realizations, ensemble means with corresponding st<strong>and</strong>ard deviations as error bars,<br />
medians). Since for each realization the maximum degradation rate kmax <strong>and</strong> half-saturation<br />
concentration MC are estimated simultaneously, the parameters are shown in scatter plots. For the<br />
homogeneous case (not shown), kmax is slightly overestimated with a value <strong>of</strong> 1.06, while for MC<br />
an underestimation is observed with MC=0.91. This error results from neglecting the dispersion<br />
process. Fig. 6 shows that normalized kmax <strong>and</strong> MC are increasingly overestimated with increasing<br />
σY 2 . Also uncertainty increases with σY 2 . This is a similar behaviour as found for the first order rate<br />
constants in case A. Approximate orientation <strong>of</strong> the data points along a diagonal axis with positive<br />
slope gives evidence <strong>of</strong> a weak positive correlation between k max <strong>and</strong> M C. An overestimation <strong>of</strong><br />
kmax increases the degradation rate as long as concentrations are higher than MC. However,<br />
overestimation <strong>of</strong> MC raises the concentration threshold at which kinetic degradation transits from<br />
zeroth to slower first order, which counter-balances the effects <strong>of</strong> the kmax overestimation.<br />
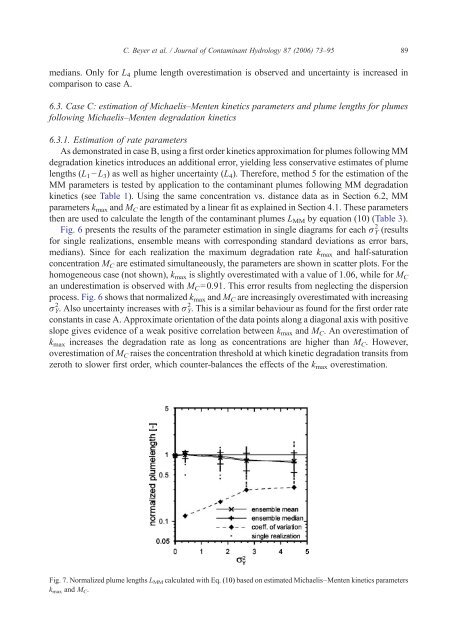
Fig. 7. Normalized plume lengths LMM calculated with Eq. (10) based on estimated Michaelis–Menten kinetics parameters<br />
k max <strong>and</strong> M C.<br />
89


