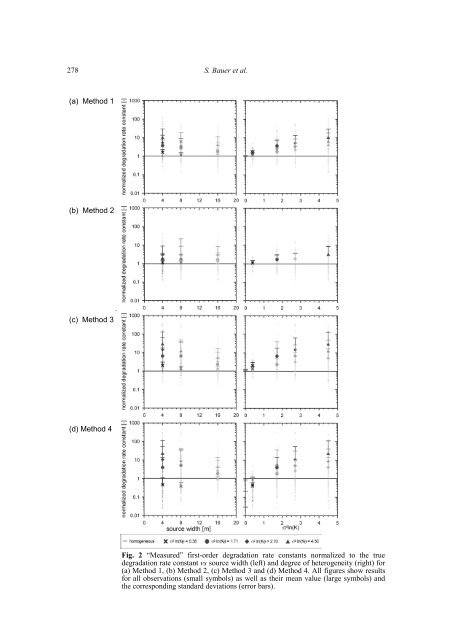
Assessing measurements <strong>of</strong> first-order degradation rates through the virtual aquifer approach 277 the hydraulic conductivity. For each realization, the procedures described above were followed <strong>and</strong> a degradation rate was calculated for each method, at each downstream well <strong>and</strong> for every source width. RESULTS AND DISCUSSION Figure 2 illustrates the results for the calculated first-order rate constants. Calculated rate constants were reported as normalized rate constants (i.e. the calculated rate constant was divided by the true rate constant used in the <strong>numerical</strong> simulation). The normalized rate constant can thus be interpreted as an overestimated factor or an underestimated factor. Inspection <strong>of</strong> Fig. 2 yields that most calculated rates are higher than one (i.e. the degradation rate is overestimated). This conclusion is quite concerning for single realizations, where overestimations can be <strong>of</strong> several orders <strong>of</strong> magnitude. On the lefth<strong>and</strong> side <strong>of</strong> Fig. 2(a), the variation <strong>of</strong> the calculated normalized rate with the source zone width is illustrated. It is clear that for Method 1, the calculated rates improve when the source zone width is increased; this is because Method 1 does not account for dilution, dispersion or measurements outside <strong>of</strong> the plume. These factors become less relevant with increasing source width since the basic assumptions inherent in Method 1 are better fulfilled, <strong>and</strong> the overestimation factor drops accordingly. On the right-h<strong>and</strong> side <strong>of</strong> Fig. 2(a), the dependence <strong>of</strong> the calculated rate on the degree <strong>of</strong> heterogeneity (given as variance) is shown. It is obvious that an increase <strong>of</strong> σ²ln(KF) leads to an overestimation <strong>of</strong> the calculated degradation rate. Furthermore, the st<strong>and</strong>ard deviation <strong>of</strong> the mean calculated degradation rate increases, leading to greater uncertainty in the calculated rate. For the smallest degree <strong>of</strong> heterogeneity the mean overestimation is a factor a bit smaller than 2, which increases to values between 3 <strong>and</strong> 5 for medium to high heterogeneity, <strong>and</strong> 10 for very high heterogeneity. Figure 2(b) shows the results for Method 2. Degradation rates for this method were also overestimated. However, when comparing this method to Method 1, the overestimation factor <strong>and</strong> st<strong>and</strong>ard deviation are generally smaller (i.e. both the error <strong>and</strong> the uncertainty are lower compared to Method 1). When examining the left-h<strong>and</strong> side <strong>of</strong> Fig. 2(b), the calculated rates show no dependence on source width. This effect is inherent to the method, since Method 2 accounts for dispersion, dilution <strong>and</strong> measurements taken outside <strong>of</strong> the plume. Method 3 depicts results similar to Method 1 regarding the rate dependence on source width <strong>and</strong> on the degree <strong>of</strong> heterogeneity (Fig. 2(c)). However, the normalized degradation rates for Method 3 are higher than for Method 1 (<strong>and</strong> also higher than Method 2); this is due to the dispersivity term. In comparison to Method 1, a portion <strong>of</strong> the concentration reduction from the source observation well to the downstream observation well is attributed to dispersion <strong>and</strong> corrected for, <strong>and</strong> thus a higher degradation rate is estimated. Method 4 (Fig. 2(d)) displays behaviour similar to Method 3, except that the rate values are slightly lower. Lower rate values are attributed to the additional term in the rate equation, which accounts for transverse dispersion. It should also be noted that at the lowest degree <strong>of</strong> heterogeneity, the normalized degradation rates were actually underestimated; this is due to an “over correction” <strong>of</strong> the effects for transverse dispersion. To effectively illustrate the over <strong>and</strong> underestimation <strong>of</strong> the degradation rates for all four methods, the degradation rates where calculated (for a homogeneous hydraulic conductivity) <strong>and</strong>
278 (a) Method 1 (b) Method 2 (c) Method 3 (d) Method 4 S. Bauer et al. Fig. 2 “Measured” first-order degradation rate constants normalized to the true degradation rate constant vs source width (left) <strong>and</strong> degree <strong>of</strong> heterogeneity (right) for (a) Method 1, (b) Method 2, (c) Method 3 <strong>and</strong> (d) Method 4. All figures show results for all observations (small symbols) as well as their mean value (large symbols) <strong>and</strong> the corresponding st<strong>and</strong>ard deviations (error bars).
- Page 3 and 4: Applied numerical modeling of satur
- Page 5: Abstract Applied numerical modeling
- Page 9: Vorwort Die zurückliegenden drei J
- Page 13: List of abbreviations and mathemati
- Page 16 and 17: for the application studies outline
- Page 18 and 19: path lengths of water molecules tha
- Page 20 and 21: where vmax [s -1 ] is a maximum gro
- Page 22 and 23: domain is discretized along advecti
- Page 24 and 25: conceptional model error: wrong pro
- Page 26 and 27: The conceptual model used is a rigo
- Page 28 and 29: equires therefore a higher degradat
- Page 30 and 31: studied for heterogeneous sites wit
- Page 32 and 33: Fig. 13: Plume length overestimatio
- Page 34 and 35: concentration maximum is for the ca
- Page 36 and 37: possibilities can not be provided n
- Page 38 and 39: technischen Bauwerken. (Model based
- Page 40 and 41: Schäfer, D., Dahmke, A., Kolditz,
- Page 43: Enclosed Publication 1 Bauer, S., B
- Page 46 and 47: Assessing measurements of first-ord
- Page 50 and 51: Assessing measurements of first-ord
- Page 52 and 53: Assessing measurements of first-ord
- Page 55 and 56: WATER RESOURCES RESEARCH, VOL. 42,
- Page 57 and 58: W01420 BAUER ET AL.: ASSESSING FIRS
- Page 59 and 60: W01420 BAUER ET AL.: ASSESSING FIRS
- Page 61 and 62: W01420 BAUER ET AL.: ASSESSING FIRS
- Page 63 and 64: W01420 BAUER ET AL.: ASSESSING FIRS
- Page 65 and 66: W01420 BAUER ET AL.: ASSESSING FIRS
- Page 67 and 68: W01420 BAUER ET AL.: ASSESSING FIRS
- Page 69: Enclosed Publication 3 Beyer, C., B
- Page 72 and 73: 74 C. Beyer et al. / Journal of Con
- Page 74 and 75: 76 C. Beyer et al. / Journal of Con
- Page 76 and 77: 78 C. Beyer et al. / Journal of Con
- Page 78 and 79: 80 C. Beyer et al. / Journal of Con
- Page 80 and 81: 82 C. Beyer et al. / Journal of Con
- Page 82 and 83: 84 C. Beyer et al. / Journal of Con
- Page 84 and 85: 86 C. Beyer et al. / Journal of Con
- Page 86 and 87: 88 C. Beyer et al. / Journal of Con
- Page 88 and 89: 90 C. Beyer et al. / Journal of Con
- Page 90 and 91: 92 C. Beyer et al. / Journal of Con
- Page 92 and 93: 94 C. Beyer et al. / Journal of Con
- Page 95: Enclosed Publication 4 Bauer, S., B
- Page 98 and 99:
Einführung In dieser Arbeit wird e
- Page 100 and 101:
Entlang der so bestimmten Grundwass
- Page 102 and 103:
Für die letztgenannten Methoden m
- Page 104 and 105:
Um diesen Effekt zu verdeutlichen s
- Page 106 and 107:
Unsicherheit zu. Für Methode 3 ( A
- Page 108 and 109:
sagt sowie die zusätzliche Problem
- Page 111:
Enclosed Publication 5 Beyer, C., C
- Page 114 and 115:
(1995) yields a “hybrid” rate c
- Page 116 and 117:
2 integral scale lY of 2.67 m and l
- Page 118 and 119:
The approximate solution employed h
- Page 120 and 121:
As Bauer et al. (2006a) demonstrate
- Page 122 and 123:
Table 4: Normalized degradation rat
- Page 124 and 125:
Comparing results for source widths
- Page 127:
Enclosed Publication 6 Beyer, C., K
- Page 130 and 131:
Einleitung und Zielsetzung In Deuts
- Page 132 and 133:
die Anzahl Simulationsläufe den Vo
- Page 134 and 135:
Grundlage des Korngrößenspektrums
- Page 136 and 137:
Dies ist als konservative Abschätz
- Page 138 and 139:
Randbedingungen abhängig ist. Aus
- Page 140 and 141:
keinen Einfluss auf die abgebaute M
- Page 142 and 143:
Carsell, R. F., Parish, R. S.: Deve
- Page 144:
van Genuchten, M.T.: A closed form