

World agriculture towards 2030/2050: the 2012 revision - Fao
World agriculture towards 2030/2050: the 2012 revision - Fao
World agriculture towards 2030/2050: the 2012 revision - Fao

You also want an ePaper? Increase the reach of your titles
YUMPU automatically turns print PDFs into web optimized ePapers that Google loves.
PROOF COPY<br />
Mixed level of inputs<br />
Under mixed level of inputs only <strong>the</strong> best land is assumed to be used for high level input farming,<br />
moderately suitable and marginal lands are assumed to be used at intermediate or low level input<br />
and management circumstances. The following procedures were applied to individual 5-minute<br />
grid-cells.<br />
(1) Determine all land very suitable and suitable at high level of inputs.<br />
(2) Of <strong>the</strong> balance of land after (1), determine all land very suitable, suitable or moderately<br />
suitable at intermediate level of inputs.<br />
(3) Of <strong>the</strong> balance of land after (1) and (2), determine all suitable land (i.e. very suitable, suitable,<br />
moderately suitable or marginally suitable) at low level of inputs.<br />
Source: excerpt from Fischer et al. (2010).<br />
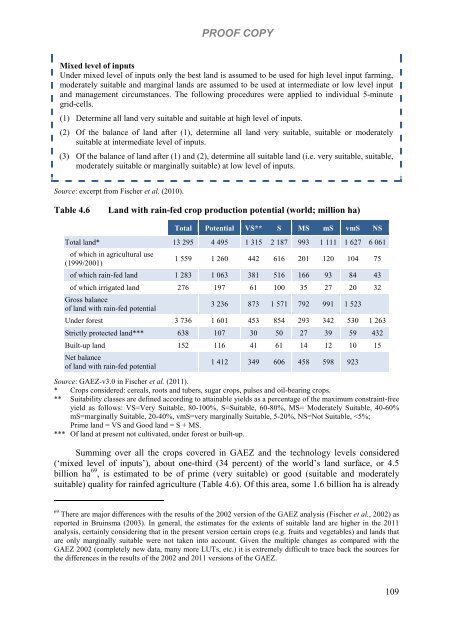
Table 4.6 Land with rain-fed crop production potential (world; million ha)<br />
Total Potential VS** S MS mS vmS NS<br />
Total land* 13 295 4 495 1 315 2 187 993 1 111 1 627 6 061<br />
of which in agricultural use<br />
(1999/2001)<br />
1 559 1 260 442 616 201 120 104 75<br />
of which rain-fed land 1 283 1 063 381 516 166 93 84 43<br />
of which irrigated land 276 197 61 100 35 27 20 32<br />
Gross balance<br />
of land with rain-fed potential<br />
3 236 873 1 571 792 991 1 523<br />
Under forest 3 736 1 601 453 854 293 342 530 1 263<br />
Strictly protected land*** 638 107 30 50 27 39 59 432<br />
Built-up land 152 116 41 61 14 12 10 15<br />
Net balance<br />
of land with rain-fed potential<br />
1 412 349 606 458 598 923<br />
Source: GAEZ-v3.0 in Fischer et al. (2011).<br />
* Crops considered: cereals, roots and tubers, sugar crops, pulses and oil-bearing crops.<br />
** Suitability classes are defined according to attainable yields as a percentage of <strong>the</strong> maximum constraint-free<br />
yield as follows: VS=Very Suitable, 80-100%, S=Suitable, 60-80%, MS= Moderately Suitable, 40-60%<br />
mS=marginally Suitable, 20-40%, vmS=very marginally Suitable, 5-20%, NS=Not Suitable,


