

World agriculture towards 2030/2050: the 2012 revision - Fao
World agriculture towards 2030/2050: the 2012 revision - Fao
World agriculture towards 2030/2050: the 2012 revision - Fao

Create successful ePaper yourself
Turn your PDF publications into a flip-book with our unique Google optimized e-Paper software.
PROOF COPY<br />
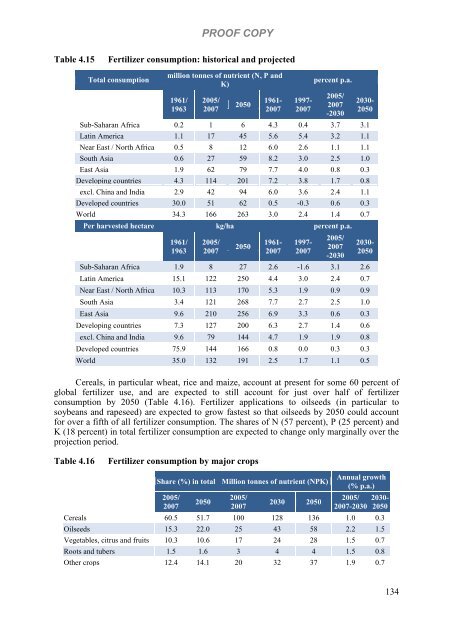
Table 4.15 Fertilizer consumption: historical and projected<br />
Total consumption<br />
million tonnes of nutrient (N, P and<br />
K)<br />
1961/<br />
1963<br />
2005/<br />
2007<br />
<strong>2050</strong><br />
1961-<br />
2007<br />
1997-<br />
2007<br />
percent p.a.<br />
2005/<br />
2007<br />
-<strong>2030</strong><br />
Sub-Saharan Africa 0.2 1 6 4.3 0.4 3.7 3.1<br />
Latin America 1.1 17 45 5.6 5.4 3.2 1.1<br />
Near East / North Africa 0.5 8 12 6.0 2.6 1.1 1.1<br />
South Asia 0.6 27 59 8.2 3.0 2.5 1.0<br />
East Asia 1.9 62 79 7.7 4.0 0.8 0.3<br />
Developing countries 4.3 114 201 7.2 3.8 1.7 0.8<br />
excl. China and India 2.9 42 94 6.0 3.6 2.4 1.1<br />
Developed countries 30.0 51 62 0.5 -0.3 0.6 0.3<br />
<strong>World</strong> 34.3 166 263 3.0 2.4 1.4 0.7<br />
Per harvested hectare kg/ha percent p.a.<br />
1961/<br />
1963<br />
2005/<br />
2007<br />
<strong>2050</strong><br />
1961-<br />
2007<br />
1997-<br />
2007<br />
2005/<br />
2007<br />
-<strong>2030</strong><br />
Sub-Saharan Africa 1.9 8 27 2.6 -1.6 3.1 2.6<br />
Latin America 15.1 122 250 4.4 3.0 2.4 0.7<br />
Near East / North Africa 10.3 113 170 5.3 1.9 0.9 0.9<br />
South Asia 3.4 121 268 7.7 2.7 2.5 1.0<br />
East Asia 9.6 210 256 6.9 3.3 0.6 0.3<br />
Developing countries 7.3 127 200 6.3 2.7 1.4 0.6<br />
excl. China and India 9.6 79 144 4.7 1.9 1.9 0.8<br />
Developed countries 75.9 144 166 0.8 0.0 0.3 0.3<br />
<strong>World</strong> 35.0 132 191 2.5 1.7 1.1 0.5<br />
<strong>2030</strong>-<br />
<strong>2050</strong><br />
<strong>2030</strong>-<br />
<strong>2050</strong><br />
Cereals, in particular wheat, rice and maize, account at present for some 60 percent of<br />
global fertilizer use, and are expected to still account for just over half of fertilizer<br />
consumption by <strong>2050</strong> (Table 4.16). Fertilizer applications to oilseeds (in particular to<br />
soybeans and rapeseed) are expected to grow fastest so that oilseeds by <strong>2050</strong> could account<br />
for over a fifth of all fertilizer consumption. The shares of N (57 percent), P (25 percent) and<br />
K (18 percent) in total fertilizer consumption are expected to change only marginally over <strong>the</strong><br />
projection period.<br />
Table 4.16 Fertilizer consumption by major crops<br />
Share (%) in total Million tonnes of nutrient (NPK)<br />
2005/<br />
2007<br />
<strong>2050</strong><br />
2005/<br />
2007<br />
<strong>2030</strong> <strong>2050</strong><br />
Annual growth<br />
(% p.a.)<br />
2005/<br />
2007-<strong>2030</strong><br />
<strong>2030</strong>-<br />
<strong>2050</strong><br />
Cereals 60.5 51.7 100 128 136 1.0 0.3<br />
Oilseeds 15.3 22.0 25 43 58 2.2 1.5<br />
Vegetables, citrus and fruits 10.3 10.6 17 24 28 1.5 0.7<br />
Roots and tubers 1.5 1.6 3 4 4 1.5 0.8<br />
O<strong>the</strong>r crops 12.4 14.1 20 32 37 1.9 0.7<br />
134


