

World agriculture towards 2030/2050: the 2012 revision - Fao
World agriculture towards 2030/2050: the 2012 revision - Fao
World agriculture towards 2030/2050: the 2012 revision - Fao

Create successful ePaper yourself
Turn your PDF publications into a flip-book with our unique Google optimized e-Paper software.
PROOF COPY<br />
increase since <strong>the</strong> early 1980s. This group includes a number of countries that turned from net<br />
exporters to net importers over this period, e.g. Senegal and Sri Lanka.<br />
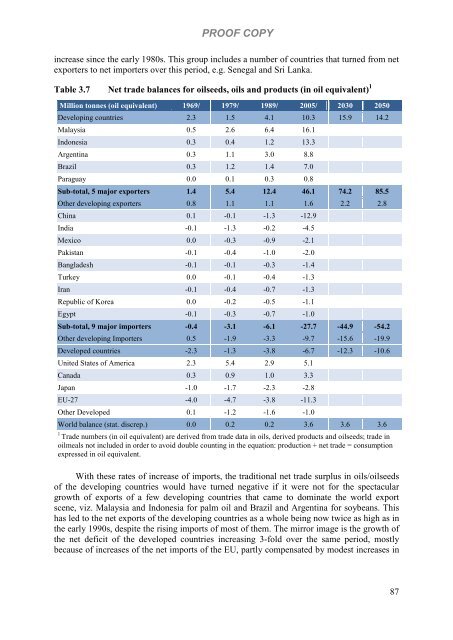
Table 3.7 Net trade balances for oilseeds, oils and products (in oil equivalent) 1<br />
Million tonnes (oil equivalent) 1969/<br />
1979/<br />
1989/<br />
2005/<br />
<strong>2030</strong> <strong>2050</strong><br />
Developing countries 2.3 1.5 4.1 10.3 15.9 14.2<br />
Malaysia 0.5 2.6 6.4 16.1<br />
Indonesia 0.3 0.4 1.2 13.3<br />
Argentina 0.3 1.1 3.0 8.8<br />
Brazil 0.3 1.2 1.4 7.0<br />
Paraguay 0.0 0.1 0.3 0.8<br />
Sub-total, 5 major exporters 1.4 5.4 12.4 46.1 74.2 85.5<br />
O<strong>the</strong>r developing exporters 0.8 1.1 1.1 1.6 2.2 2.8<br />
China 0.1 -0.1 -1.3 -12.9<br />
India -0.1 -1.3 -0.2 -4.5<br />
Mexico 0.0 -0.3 -0.9 -2.1<br />
Pakistan -0.1 -0.4 -1.0 -2.0<br />
Bangladesh -0.1 -0.1 -0.3 -1.4<br />
Turkey 0.0 -0.1 -0.4 -1.3<br />
Iran -0.1 -0.4 -0.7 -1.3<br />
Republic of Korea 0.0 -0.2 -0.5 -1.1<br />
Egypt -0.1 -0.3 -0.7 -1.0<br />
Sub-total, 9 major importers -0.4 -3.1 -6.1 -27.7 -44.9 -54.2<br />
O<strong>the</strong>r developing Importers 0.5 -1.9 -3.3 -9.7 -15.6 -19.9<br />
Developed countries -2.3 -1.3 -3.8 -6.7 -12.3 -10.6<br />
United States of America 2.3 5.4 2.9 5.1<br />
Canada 0.3 0.9 1.0 3.3<br />
Japan -1.0 -1.7 -2.3 -2.8<br />
EU-27 -4.0 -4.7 -3.8 -11.3<br />
O<strong>the</strong>r Developed 0.1 -1.2 -1.6 -1.0<br />
<strong>World</strong> balance (stat. discrep.) 0.0 0.2 0.2 3.6 3.6 3.6<br />
1 Trade numbers (in oil equivalent) are derived from trade data in oils, derived products and oilseeds; trade in<br />
oilmeals not included in order to avoid double counting in <strong>the</strong> equation: production + net trade = consumption<br />
expressed in oil equivalent.<br />
With <strong>the</strong>se rates of increase of imports, <strong>the</strong> traditional net trade surplus in oils/oilseeds<br />
of <strong>the</strong> developing countries would have turned negative if it were not for <strong>the</strong> spectacular<br />
growth of exports of a few developing countries that came to dominate <strong>the</strong> world export<br />
scene, viz. Malaysia and Indonesia for palm oil and Brazil and Argentina for soybeans. This<br />
has led to <strong>the</strong> net exports of <strong>the</strong> developing countries as a whole being now twice as high as in<br />
<strong>the</strong> early 1990s, despite <strong>the</strong> rising imports of most of <strong>the</strong>m. The mirror image is <strong>the</strong> growth of<br />
<strong>the</strong> net deficit of <strong>the</strong> developed countries increasing 3-fold over <strong>the</strong> same period, mostly<br />
because of increases of <strong>the</strong> net imports of <strong>the</strong> EU, partly compensated by modest increases in<br />
87


