

World agriculture towards 2030/2050: the 2012 revision - Fao
World agriculture towards 2030/2050: the 2012 revision - Fao
World agriculture towards 2030/2050: the 2012 revision - Fao

Create successful ePaper yourself
Turn your PDF publications into a flip-book with our unique Google optimized e-Paper software.
PROOF COPY<br />
developing countries would have declined to 740 million and some progress would have been<br />
made <strong>towards</strong> <strong>the</strong> target of halving <strong>the</strong> numbers by 2015. We shall have occasion to revisit <strong>the</strong><br />
issue of India’s sluggish response of food consumption per capita to <strong>the</strong> high growth of per<br />
capita incomes (Annex 2.1). Whe<strong>the</strong>r this pattern of response continues or not, India’s food<br />
demand outcomes will have a profound impact on <strong>the</strong> assessment of long-term prospects of<br />
world <strong>agriculture</strong> and nutrition.<br />
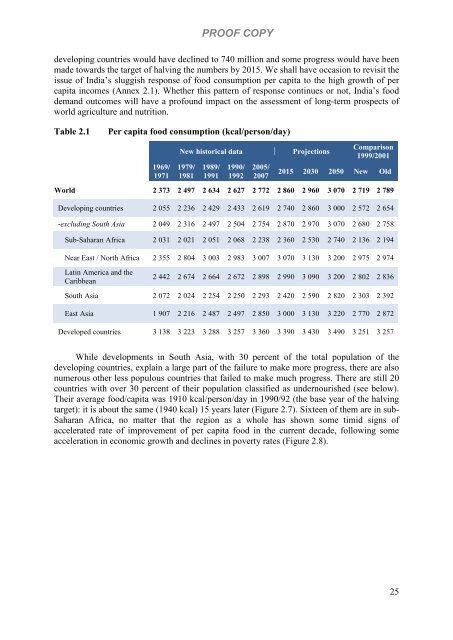
Table 2.1 Per capita food consumption (kcal/person/day)<br />
1969/<br />
1971<br />
New historical data Projections<br />
1979/<br />
1981<br />
1989/<br />
1991<br />
1990/<br />
1992<br />
2005/<br />
2007<br />
Comparison<br />
1999/2001<br />
2015 <strong>2030</strong> <strong>2050</strong> New Old<br />
<strong>World</strong> 2 373 2 497 2 634 2 627 2 772 2 860 2 960 3 070 2 719 2 789<br />
Developing countries 2 055 2 236 2 429 2 433 2 619 2 740 2 860 3 000 2 572 2 654<br />
-excluding South Asia 2 049 2 316 2 497 2 504 2 754 2 870 2 970 3 070 2 680 2 758<br />
Sub-Saharan Africa 2 031 2 021 2 051 2 068 2 238 2 360 2 530 2 740 2 136 2 194<br />
Near East / North Africa 2 355 2 804 3 003 2 983 3 007 3 070 3 130 3 200 2 975 2 974<br />
Latin America and <strong>the</strong><br />
Caribbean<br />
2 442 2 674 2 664 2 672 2 898 2 990 3 090 3 200 2 802 2 836<br />
South Asia 2 072 2 024 2 254 2 250 2 293 2 420 2 590 2 820 2 303 2 392<br />
East Asia 1 907 2 216 2 487 2 497 2 850 3 000 3 130 3 220 2 770 2 872<br />
Developed countries 3 138 3 223 3 288 3 257 3 360 3 390 3 430 3 490 3 251 3 257<br />
While developments in South Asia, with 30 percent of <strong>the</strong> total population of <strong>the</strong><br />
developing countries, explain a large part of <strong>the</strong> failure to make more progress, <strong>the</strong>re are also<br />
numerous o<strong>the</strong>r less populous countries that failed to make much progress. There are still 20<br />
countries with over 30 percent of <strong>the</strong>ir population classified as undernourished (see below).<br />
Their average food/capita was 1910 kcal/person/day in 1990/92 (<strong>the</strong> base year of <strong>the</strong> halving<br />
target): it is about <strong>the</strong> same (1940 kcal) 15 years later (Figure 2.7). Sixteen of <strong>the</strong>m are in sub-<br />
Saharan Africa, no matter that <strong>the</strong> region as a whole has shown some timid signs of<br />
accelerated rate of improvement of per capita food in <strong>the</strong> current decade, following some<br />
acceleration in economic growth and declines in poverty rates (Figure 2.8).<br />
25


