Download PDF - ETP - Pemandu
Download PDF - ETP - Pemandu
Download PDF - ETP - Pemandu

You also want an ePaper? Increase the reach of your titles
YUMPU automatically turns print PDFs into web optimized ePapers that Google loves.
These are encouraging green shoots of economic recovery<br />
in 2012. On the other hand, China has managed to rein in<br />
inflation and is in a good position to stimulate growth in the<br />
event of a sharper than expected drop in external demand,<br />
despite a downward revision of its 2012 Gross Domestic<br />
Product (GDP) forecast to 7.5 per cent.<br />
Malaysia’s economy is resilient<br />
and evolving<br />
In the face of supply chain disruptions caused by the<br />
Japanese and Thai disasters as well as soft export demand<br />
from the Eurozone, Malaysia’s economy continued to grow<br />
on the back of resilient domestic demand and stronger<br />
exports. The nation’s GDP grew at 5.1 per cent in 2011. Our<br />
GDP grew by seven per cent in 2010. With the <strong>ETP</strong> beginning<br />
to have an impact in 2012 and beyond, we are pursuing our<br />
annual six per cent average growth target.<br />
From an exports perspective, Malaysia’s dependency on<br />
the US and Eurozone has declined to 12.2 per cent and<br />
11 per cent respectively on average between 2007 and<br />
2010, while intra-regional trade has risen to above 50 per<br />
cent. Nonetheless, some of these exports are still linked<br />
to demand in the developed economies as part of the<br />
regional production supply chain to the US and Eurozone.<br />
Sluggish performances in these regions will impact<br />
Malaysia’s trade performance.<br />
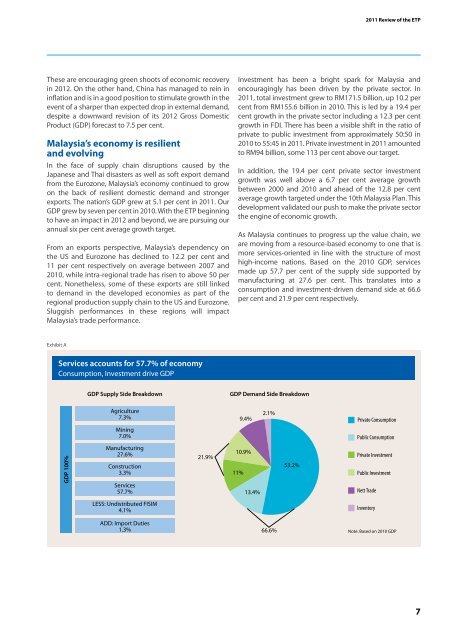
Exhibit A<br />
Services accounts for 57.7% of economy<br />
Consumption, Investment drive GDP<br />
GDP 100%<br />
GDP Supply Side Breakdown GDP Demand Side Breakdown<br />
Agriculture<br />
7.3%<br />
Mining<br />
7.0%<br />
Manufacturing<br />
27.6%<br />
Construction<br />
3.3%<br />
Services<br />
57.7%<br />
LESS: Undistributed FISIM<br />
4.1%<br />
ADD: Import Duties<br />
1.3%<br />
21.9%<br />
Investment has been a bright spark for Malaysia and<br />
encouragingly has been driven by the private sector. In<br />
2011, total investment grew to RM171.5 billion, up 10.2 per<br />
cent from RM155.6 billion in 2010. This is led by a 19.4 per<br />
cent growth in the private sector including a 12.3 per cent<br />
growth in FDI. There has been a visible shift in the ratio of<br />
private to public investment from approximately 50:50 in<br />
2010 to 55:45 in 2011. Private investment in 2011 amounted<br />
to RM94 billion, some 113 per cent above our target.<br />
In addition, the 19.4 per cent private sector investment<br />
growth was well above a 6.7 per cent average growth<br />
between 2000 and 2010 and ahead of the 12.8 per cent<br />
average growth targeted under the 10th Malaysia Plan. This<br />
development validated our push to make the private sector<br />
the engine of economic growth.<br />
As Malaysia continues to progress up the value chain, we<br />
are moving from a resource-based economy to one that is<br />
more services-oriented in line with the structure of most<br />
high-income nations. Based on the 2010 GDP, services<br />
made up 57.7 per cent of the supply side supported by<br />
manufacturing at 27.6 per cent. This translates into a<br />
consumption and investment-driven demand side at 66.6<br />
per cent and 21.9 per cent respectively.<br />
11%<br />
9.4%<br />
10.9%<br />
13.4%<br />
2.1%<br />
66.6%<br />
53.2%<br />
2011 Review of the <strong>ETP</strong><br />
Private Consumption<br />
Public Consumption<br />
Private Investment<br />
Public Investment<br />
Nett Trade<br />
Inventory<br />
Note: Based on 2010 GDP<br />
7