

IMMOEAST Annual Report 2006/07
IMMOEAST Annual Report 2006/07
IMMOEAST Annual Report 2006/07

Create successful ePaper yourself
Turn your PDF publications into a flip-book with our unique Google optimized e-Paper software.
110 <strong>IMMOEAST</strong> <strong>Annual</strong> <strong>Report</strong> <strong>2006</strong>/<strong>07</strong><br />
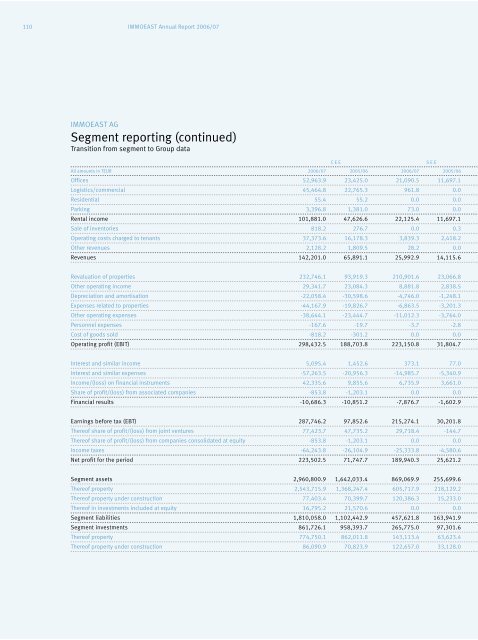
<strong>IMMOEAST</strong> AG<br />
Segment reporting (continued)<br />
Transition from segment to Group data<br />
C E E S E E<br />
All amounts in TEUR <strong>2006</strong>/<strong>07</strong> 2005/06 <strong>2006</strong>/<strong>07</strong> 2005/06<br />
Offices 52,963.9 23,425.0 21,090.5 11,697.1<br />
Logistics/commercial 45,464.8 22,765.3 961.8 0.0<br />
Residential 55.4 55.2 0.0 0.0<br />
Parking 3,396.8 1,381.0 73.0 0.0<br />
Rental income 101,881.0 47,626.6 22,125.4 11,697.1<br />
Sale of inventories 818.2 276.7 0.0 0.3<br />
Operating costs charged to tenants 37,373.6 16,178.3 3,839.3 2,418.2<br />
Other revenues 2,128.2 1,809.5 28.2 0.0<br />
Revenues 142,201.0 65,891.1 25,992.9 14,115.6<br />
Revaluation of properties 232,746.1 93,919.3 210,901.6 23,066.8<br />
Other operating income 29,341.7 23,084.3 8,881.8 2,838.5<br />
Depreciation and amortisation -22,058.4 -30,598.6 -4,746.0 -1,248.1<br />
Expenses related to properties -44,167.9 -19,826.7 -6,863.5 -3,201.3<br />
Other operating expenses -38,644.1 -23,444.7 -11,012.3 -3,764.0<br />
Personnel expenses -167.6 -19.7 -3.7 -2.8<br />
Cost of goods sold -818.2 -301.2 0.0 0.0<br />
Operating profit (EBIT) 298,432.5 188,703.8 223,150.8 31,804.7<br />
Interest and similar income 5,095.4 1,452.6 373.1 77.0<br />
Interest and similar expenses -57,263.5 -20,956.3 -14,985.7 -5,340.9<br />
Income/(loss) on financial instruments 42,335.6 9,855.6 6,735.9 3,661.0<br />
Share of profit/(loss) from associated companies -853.8 -1,203.1 0.0 0.0<br />
Financial results -10,686.3 -10,851.2 -7,876.7 -1,602.9<br />
Earnings before tax (EBT) 287,746.2 97,852.6 215,274.1 30,201.8<br />
Thereof share of profit/(loss) from joint ventures 77,423.7 47,735.2 29,718.4 -144.7<br />
Thereof share of profit/(loss) from companies consolidated at equity -853.8 -1,203.1 0.0 0.0<br />
Income taxes -64,243.8 -26,104.9 -25,333.8 -4,580.6<br />
Net profit for the period 223,502.5 71,747.7 189,940.3 25,621.2<br />
Segment assets 2,960,800.9 1,642,033.4 869,069.9 255,699.6<br />
Thereof property 2,543,715.9 1,368,247.4 605,717.9 218,129.2<br />
Thereof property under construction 77,403.4 70,399.7 120,386.3 15,233.0<br />
Thereof in investments included at equity 16,795.2 21,570.6 0.0 0.0<br />
Segment liabilities 1,810,058.0 1,102,442.9 457,621.8 163,941.9<br />
Segment investments 861,726.1 958,393.7 265,775.0 97,301.6<br />
Thereof property 774,750.1 862,011.8 143,113.4 63,623.4<br />
Thereof property under construction 86,090.9 70,823.9 122,657.0 33,128.0