

IMMOEAST Annual Report 2006/07
IMMOEAST Annual Report 2006/07
IMMOEAST Annual Report 2006/07

You also want an ePaper? Increase the reach of your titles
YUMPU automatically turns print PDFs into web optimized ePapers that Google loves.
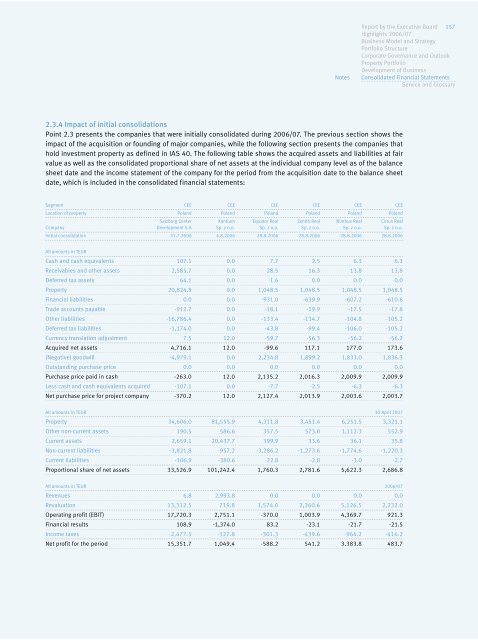
2.3.4Impactofinitialconsolidations<br />
Point 2.3 presents the companies that were initially consolidated during <strong>2006</strong>/<strong>07</strong>. The previous section shows the<br />
impact of the acquisition or founding of major companies, while the following section presents the companies that<br />
hold investment property as defined in IAS 40. The following table shows the acquired assets and liabilities at fair<br />
value as well as the consolidated proportional share of net assets at the individual company level as of the balance<br />
sheet date and the income statement of the company for the period from the acquisition date to the balance sheet<br />
date, which is included in the consolidated financial statements:<br />
Segment CEE CEE CEE CEE CEE CEE<br />
Location of property Poland Poland Poland Poland Poland Poland<br />
Salzburg Center Xantium Equator Real Zenith Real Nimbus Real Cirrus Real<br />
Company Development S.A Sp. z o.o. Sp. z o.o. Sp. z o.o. Sp. z o.o. Sp. z o.o.<br />
Initial consolidation 31.7.<strong>2006</strong> 4.8.<strong>2006</strong> 28.8.<strong>2006</strong> 28.8.<strong>2006</strong> 28.8.<strong>2006</strong> 28.8.<strong>2006</strong><br />
All amounts in TEUR<br />
Cash and cash equivalents 1<strong>07</strong>.1 0.0 7.7 2.5 6.3 6.3<br />
Receivables and other assets 2,585.7 0.0 28.5 16.3 13.8 13.8<br />
Deferred tax assets 64.1 0.0 1.6 0.0 0.0 0.0<br />
Property 20,824.8 0.0 1,048.5 1,048.5 1,048.5 1,048.5<br />
Financial liabilities 0.0 0.0 -931.0 -639.9 -6<strong>07</strong>.2 -610.6<br />
Trade accounts payable -912.7 0.0 -18.1 -19.9 -17.5 -17.8<br />
Other liabilities -16,786.4 0.0 -133.4 -134.7 -104.8 -105.2<br />
Deferred tax liabilities -1,174.0 0.0 -43.8 -99.4 -106.0 -105.2<br />
Currency translation adjustment 7.5 12.0 -59.7 -56.3 -56.2 -56.2<br />
Acquired net assets 4,716.1 12.0 -99.6 117.1 177.0 173.6<br />
(Negative) goodwill -4,979.1 0.0 2,234.8 1,899.2 1,833.0 1,836.3<br />
Outstanding purchase price 0.0 0.0 0.0 0.0 0.0 0.0<br />
Purchase price paid in cash -263.0 12.0 2,135.2 2,016.3 2,009.9 2,009.9<br />
Less cash and cash equivalents acquired -1<strong>07</strong>.1 0.0 -7.7 -2.5 -6.3 -6.3<br />
Net purchase price for project company -370.2 12.0 2,127.4 2,013.9 2,003.6 2,003.7<br />
All amounts in TEUR 30 April 20<strong>07</strong><br />
Property 34,606.0 81,555.9 4,311.8 3,451.4 6,251.5 3,321.1<br />
Other non-current assets 190.5 586.6 357.5 573.0 1,112.3 552.9<br />
Current assets 2,659.1 20,437.7 399.9 33.6 36.1 35.8<br />
Non-current liabilities -3,821.8 -957.2 -3,286.2 -1,273.6 -1,774.6 -1,220.3<br />
Current liabilities -106.9 -380.6 -22.8 -2.8 -3.0 -2.7<br />
Proportional share of net assets 33,526.9 101,242.4 1,760.3 2,781.6 5,622.3 2,686.8<br />
All amounts in TEUR <strong>2006</strong>/<strong>07</strong><br />
Revenues 6.8 2,993.8 0.0 0.0 0.0 0.0<br />
Revaluation 13,312.5 719.8 1,574.0 2,360.6 5,126.5 2,232.0<br />
Operating profit (EBIT) 17,720.3 2,751.1 -370.0 1,003.9 4,369.7 921.3<br />
Financial results 108.9 -1,374.0 83.2 -23.1 -21.7 -21.5<br />
Notes<br />
Income taxes -2,477.5 -327.8 -301.3 -439.6 -964.2 -416.2<br />
Net profit for the period 15,351.7 1,049.4 -588.2 541.2 3.383.8 483.7<br />
<strong>Report</strong> by the Executive Board 157<br />
Highlights <strong>2006</strong>/<strong>07</strong><br />
Business Model and Strategy<br />
Portfolio Structure<br />
Corporate Governance and Outlook<br />
Property Portfolio<br />
Development of Business<br />
Consolidated Financial Statements<br />
Service and Glossary