

IMMOEAST Annual Report 2006/07
IMMOEAST Annual Report 2006/07
IMMOEAST Annual Report 2006/07

Create successful ePaper yourself
Turn your PDF publications into a flip-book with our unique Google optimized e-Paper software.
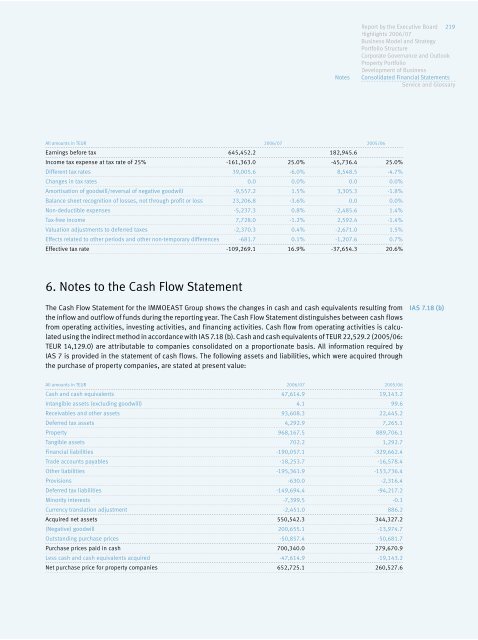
All amounts in TEUR <strong>2006</strong>/<strong>07</strong> 2005/06<br />
Earnings before tax 645,452.2 182,945.6<br />
Income tax expense at tax rate of 25% -161,363.0 25.0% -45,736.4 25.0%<br />
Different tax rates 39,005.6 -6.0% 8,548.5 -4.7%<br />
Changes in tax rates 0.0 0.0% 0.0 0.0%<br />
Amortisation of goodwill/reversal of negative goodwill -9,557.2 1.5% 3,305.3 -1.8%<br />
Balance sheet recognition of losses, not through profit or loss 23,206.8 -3.6% 0.0 0.0%<br />
Non-deductible expenses -5,237.3 0.8% -2,485.6 1.4%<br />
Tax-free income 7,728.0 -1.2% 2,592.4 -1.4%<br />
Valuation adjustments to deferred taxes -2,370.3 0.4% -2,671.0 1.5%<br />
Effects related to other periods and other non-temporary differences -681.7 0.1% -1,2<strong>07</strong>.6 0.7%<br />
Effective tax rate -109,269.1 16.9% -37,654.3 20.6%<br />
6. Notes to the Cash Flow Statement<br />
The Cash Flow Statement for the <strong>IMMOEAST</strong> Group shows the changes in cash and cash equivalents resulting from<br />
the inflow and outflow of funds during the reporting year. The Cash Flow Statement distinguishes between cash flows<br />
from operating activities, investing activities, and financing activities. Cash flow from operating activities is calculated<br />
using the indirect method in accordance with IAS 7.18 (b). Cash and cash equivalents of TEUR 22,529.2 (2005/06:<br />
TEUR 14,129.0) are attributable to companies consolidated on a proportionate basis. All information required by<br />
IAS 7 is provided in the statement of cash flows. The following assets and liabilities, which were acquired through<br />
the purchase of property companies, are stated at present value:<br />
All amounts in TEUR <strong>2006</strong>/<strong>07</strong> 2005/06<br />
Cash and cash equivalents 47,614.9 19,143.2<br />
Intangible assets (excluding goodwill) 4.1 99.6<br />
Receivables and other assets 93,608.3 22,445.2<br />
Deferred tax assets 4,292.9 7,265.1<br />
Property 968,167.5 889,706.1<br />
Tangible assets 702.2 1,292.7<br />
Financial liabilities -190,057.1 -329,662.4<br />
Trade accounts payables -18,253.7 -16,578.4<br />
Other liabilities -195,361.9 -153,736.4<br />
Provisions -630.0 -2,316.4<br />
Deferred tax liabilities -149,694.4 -94,217.2<br />
Minority interests -7,399.5 -0.1<br />
Currency translation adjustment -2,451.0 886.2<br />
Acquired net assets 550,542.3 344,327.2<br />
(Negative) goodwill 200,655.1 -13,974.7<br />
Outstanding purchase prices -50,857.4 -50,681.7<br />
Purchase prices paid in cash 700,340.0 279,670.9<br />
Less cash and cash equivalents acquired -47,614.9 -19,143.2<br />
Net purchase price for property companies 652,725.1 260,527.6<br />
Notes<br />
<strong>Report</strong> by the Executive Board 219<br />
Highlights <strong>2006</strong>/<strong>07</strong><br />
Business Model and Strategy<br />
Portfolio Structure<br />
Corporate Governance and Outlook<br />
Property Portfolio<br />
Development of Business<br />
Consolidated Financial Statements<br />
Service and Glossary<br />
IAS7.18(b)