

IMMOEAST Annual Report 2006/07
IMMOEAST Annual Report 2006/07
IMMOEAST Annual Report 2006/07

Create successful ePaper yourself
Turn your PDF publications into a flip-book with our unique Google optimized e-Paper software.
78 <strong>IMMOEAST</strong> <strong>Annual</strong> <strong>Report</strong> <strong>2006</strong>/<strong>07</strong><br />
246% increase in EBIT<br />
Development of earnings<br />
influenced by declining returns<br />
in Central and Eastern Europe<br />
Operating profit (EBIT)<br />
EBIT reached a new record level in <strong>2006</strong>/<strong>07</strong>, rising by 246% to TEUR 541,288.7. As in previous years,<br />
this development was strongly influenced by the development of revaluation results. In 2005/06<br />
revaluation results represented 75% or TEUR 116,986.1 of Group EBIT totalling TEUR 156,269.4,<br />
but this figure comprised 91% or TEUR 493,095.1 of Group EBIT (TEUR 541,288.6) for the reporting<br />
year. The contribution made by revenues to EBIT declined from TEUR 80,014.5 or 51% in 2005/06 to<br />
TEUR 192,920.4 or 36% in the <strong>2006</strong>/<strong>07</strong> financial year.<br />
The primary reason for this development was the yield compression, which influenced the entire<br />
Central and East European region. While prime yields averaged slightly more than 6.0% in the previous<br />
year, transactions – above all in the CEE segment – approached the 5.0%-mark and, in individual<br />
cases, fell below this level after the balance sheet date on 30 April 20<strong>07</strong>. Returns in the SEE<br />
segment fell by a more substantial margin, especially in Romania and Bulgaria. The prime yield<br />
remained near 8.0% in the previous year, but is now only slightly more than 6.0% in Romania and<br />
7.0%, in Bulgaria.<br />
This development is clearly demonstrated by the above comparison of EBIT and revaluation results<br />
by segment. The CEE segment recorded an increase of roughly 175% or TEUR 189,728.7 over<br />
the previous year, maintaining its leading position over the other two segments. The largest contributions<br />
to EBIT and revaluation results in the CEE segment were provided by the Czech Republic<br />
(TEUR 157,<strong>07</strong>1.0) and Poland (TEUR 81,234.3).<br />
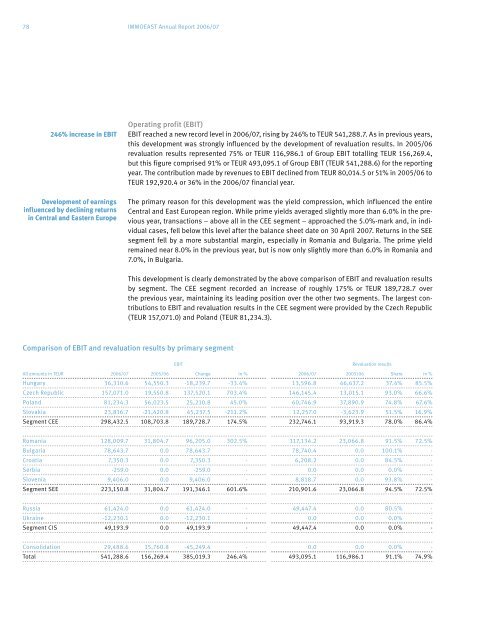
Comparison of EBIT and revaluation results by primary segment<br />
EBIT Revaluation results<br />
All amounts in TEUR <strong>2006</strong>/<strong>07</strong> 2005/06 Change in % <strong>2006</strong>/<strong>07</strong> 2005/06 Share in %<br />
Hungary 36,310.6 54,550.3 -18,239.7 -33.4% 13,596.8 46,637.2 37.4% 85.5%<br />
Czech Republic 157,<strong>07</strong>1.0 19,550.8 137,520.1 703.4% 146,145.4 13,015.1 93.0% 66.6%<br />
Poland 81,234.3 56,023.5 25,210.8 45.0% 60,746.9 37,890.9 74.8% 67.6%<br />
Slovakia 23,816.7 -21,420.8 45,237.5 -211.2% 12,257.0 -3,623.9 51.5% 16.9%<br />
Segment CEE 298,432.5 108,703.8 189,728.7 174.5% 232,746.1 93,919.3 78.0% 86.4%<br />
Romania 128,009.7 31,804.7 96,205.0 302.5% 117,134.2 23,066.8 91.5% 72.5%<br />
Bulgaria 78,643.7 0.0 78,643.7 - 78,740.4 0.0 100.1% -<br />
Croatia 7,350.3 0.0 7,350.3 - 6,208.2 0.0 84.5% -<br />
Serbia -259.0 0.0 -259.0 - 0.0 0.0 0.0% -<br />
Slovenia 9,406.0 0.0 9,406.0 - 8,818.7 0.0 93.8% -<br />
Segment SEE 223,150.8 31,804.7 191,346.1 601.6% 210,901.6 23,066.8 94.5% 72.5%<br />
Russia 61,424.0 0.0 61,424.0 - 49,447.4 0.0 80.5% -<br />
Ukraine -12,230.1 0.0 -12,230.1 - 0.0 0.0 0.0% -<br />
Segment CIS 49,193.9 0.0 49,193.9 - 49,447.4 0.0 0.0% -<br />
Consolidation 29,488.6 15,760.8 -45,249.4 - 0.0 0.0 0.0% -<br />
Total 541,288.6 156,269.4 385,019.3 246.4% 493,095.1 116,986.1 91.1% 74.9%