

IMMOEAST Annual Report 2006/07
IMMOEAST Annual Report 2006/07
IMMOEAST Annual Report 2006/07

Create successful ePaper yourself
Turn your PDF publications into a flip-book with our unique Google optimized e-Paper software.
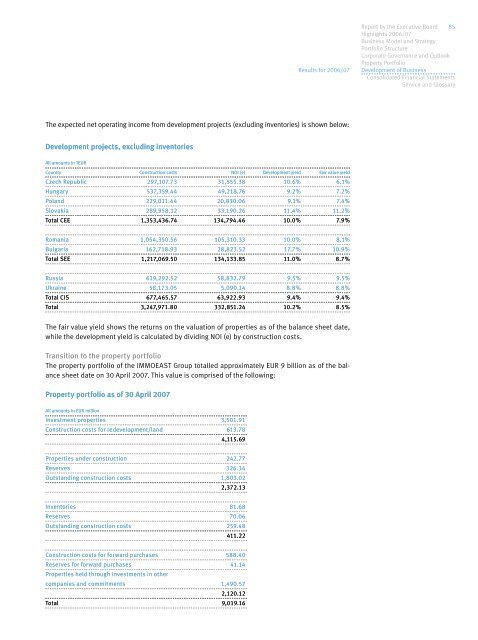
The expected net operating income from development projects (excluding inventories) is shown below:<br />
Development projects, excluding inventories<br />
All amounts in TEUR<br />
Country Construction costs NOI (e) Development yield Fair value yield<br />
Czech Republic 297,1<strong>07</strong>.73 31,555.38 10.6% 6.1%<br />
Hungary 537,359.44 49,218.76 9.2% 7.2%<br />
Poland 229,011.44 20,830.06 9.1% 7.4%<br />
Slovakia 289,958.12 33,190.26 11.4% 11.2%<br />
Total CEE 1,353,436.74 134,794.46 10.0% 7.9%<br />
Romania 1,054,350.56 105,310.33 10.0% 8.1%<br />
Bulgaria 162,718.93 28,823.52 17.7% 10.9%<br />
Total SEE 1,217,069.50 134,133.85 11.0% 8.7%<br />
Russia 619,292.52 58,832.79 9.5% 9.5%<br />
Ukraine 58,173.05 5,090.14 8.8% 8.8%<br />
Total CIS 677,465.57 63,922.93 9.4% 9.4%<br />
Total 3,247,971.80 332,851.24 10.2% 8.5%<br />
The fair value yield shows the returns on the valuation of properties as of the balance sheet date,<br />
while the development yield is calculated by dividing NOI (e) by construction costs.<br />
Transition to the property portfolio<br />
The property portfolio of the <strong>IMMOEAST</strong> Group totalled approximately EUR 9 billion as of the balance<br />
sheet date on 30 April 20<strong>07</strong>. This value is comprised of the following:<br />
Property portfolio as of 30 April 20<strong>07</strong><br />
All amounts in EUR million<br />
Investment properties 3,501.91<br />
Construction costs for redevelopment/land 613.78<br />
4,115.69<br />
Properties under construction 242.77<br />
Reserves 326.34<br />
Outstanding construction costs 1,803.02<br />
2,372.13<br />
Inventories 81.68<br />
Reserves 70.06<br />
Outstanding construction costs 259.48<br />
411.22<br />
Construction costs for forward purchases 588.40<br />
Reserves for forward purchases<br />
Properties held through investments in other<br />
41.14<br />
companies and commitments 1,490.57<br />
2,120.12<br />
Total 9,019.16<br />
Results for <strong>2006</strong>/<strong>07</strong><br />
<strong>Report</strong> by the Executive Board 85<br />
Highlights <strong>2006</strong>/<strong>07</strong><br />
Business Model and Strategy<br />
Portfolio Structure<br />
Corporate Governance and Outlook<br />
Property Portfolio<br />
Development of Business<br />
Consolidated Financial Statements<br />
Service and Glossary