

IMMOEAST Annual Report 2006/07
IMMOEAST Annual Report 2006/07
IMMOEAST Annual Report 2006/07

You also want an ePaper? Increase the reach of your titles
YUMPU automatically turns print PDFs into web optimized ePapers that Google loves.
168 <strong>IMMOEAST</strong> <strong>Annual</strong> <strong>Report</strong> <strong>2006</strong>/<strong>07</strong><br />
Segment<br />
All amounts in TEUR<br />
CEE CIS SEE<br />
Holding company,<br />
other and<br />
Group eliminations Total<br />
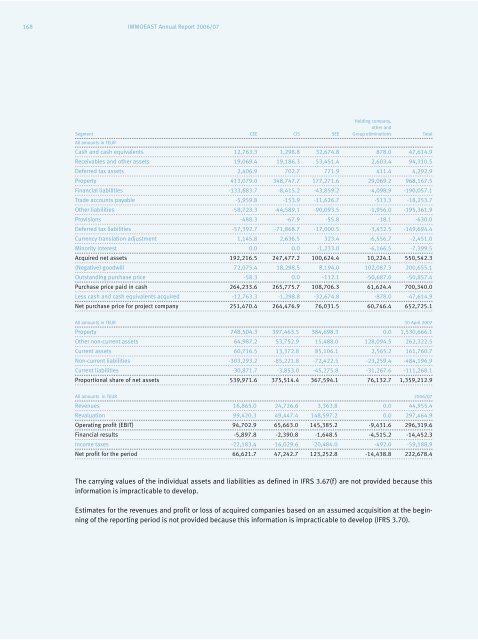
Cash and cash equivalents 12,763.3 1,298.8 32,674.8 878.0 47,614.9<br />
Receivables and other assets 19,069.4 19,186.3 53,451.4 2,603.4 94,310.5<br />
Deferred tax assets 2,406.9 702.7 771.9 411.4 4,292.9<br />
Property 413,<strong>07</strong>9.0 348,747.7 177,271.6 29,069.2 968,167.5<br />
Financial liabilities -133,683.7 -8,415.2 -43,859.2 -4,098.9 -190,057.1<br />
Trade accounts payable -5,959.8 -153.9 -11,626.7 -513.3 -18,253.7<br />
Other liabilities -58,723.3 -44,589.1 -90,093.5 -1,956.0 -195,361.9<br />
Provisions -488.3 -67.9 -55.8 -18.1 -630.0<br />
Deferred tax liabilities -57,392.7 -71,868.7 -17,000.5 -3,432.5 -149,694.4<br />
Currency translation adjustment 1,145.8 2,636.5 323.4 -6,556.7 -2,451.0<br />
Minority interest 0.0 0.0 -1,233.0 -6,166.5 -7,399.5<br />
Acquired net assets 192,216.5 247,477.2 100,624.4 10,224.1 550,542.3<br />
(Negative) goodwill 72,<strong>07</strong>5.4 18,298.5 8,194.0 102,087.3 200,655.1<br />
Outstanding purchase price -58.3 0.0 -112.1 -50,687.0 -50,857.4<br />
Purchase price paid in cash 264,233.6 265,775.7 108,706.3 61,624.4 700,340.0<br />
Less cash and cash equivalents acquired -12,763.3 -1,298.8 -32,674.8 -878.0 -47,614.9<br />
Net purchase price for project company 251,470.4 264,476.9 76,031.5 60,746.4 652,725.1<br />
All amounts in TEUR 30 April 20<strong>07</strong><br />
Property 748,504.3 397,463.5 384,698.3 0.0 1,530,666.1<br />
Other non-current assets 64,987.2 53,752.9 15,488.0 128,094.5 262,322.5<br />
Current assets 60,716.5 13,372.8 85,106.1 2,565.2 161,760.7<br />
Non-current liabilities -303,293.2 -85,221.8 -72,422.5 -23,259.4 -484,196.9<br />
Current liabilities -30,871.7 -3,853.0 -45,275.8 -31,267.6 -111,268.1<br />
Proportional share of net assets 539,971.6 375,514.4 367,594.1 76,132.7 1,359,212.9<br />
All amounts in TEUR <strong>2006</strong>/<strong>07</strong><br />
Revenues 16,865.0 24,726.6 3,363.8 0.0 44,955.4<br />
Revaluation 99,420.3 49,447.4 148,597.2 0.0 297,464.9<br />
Operating profit (EBIT) 94,702.9 65,663.0 145,385.2 -9,431.6 296,319.6<br />
Financial results -5,897.8 -2,390.8 -1,648.5 -4,515.2 -14,452.3<br />
Income taxes -22,183.4 -16,029.6 -20,484.0 -492.0 -59,188.9<br />
Net profit for the period 66,621.7 47,242.7 123,252.8 -14,438.8 222,678.4<br />
The carrying values of the individual assets and liabilities as defined in IFRS 3.67(f) are not provided because this<br />
information is impracticable to develop.<br />
Estimates for the revenues and profit or loss of acquired companies based on an assumed acquisition at the beginning<br />
of the reporting period is not provided because this information is impracticable to develop (IFRS 3.70).