

IMMOEAST Annual Report 2006/07
IMMOEAST Annual Report 2006/07
IMMOEAST Annual Report 2006/07

Create successful ePaper yourself
Turn your PDF publications into a flip-book with our unique Google optimized e-Paper software.
92 <strong>IMMOEAST</strong> <strong>Annual</strong> <strong>Report</strong> <strong>2006</strong>/<strong>07</strong><br />
Strong improvement in<br />
revenues and earnings<br />
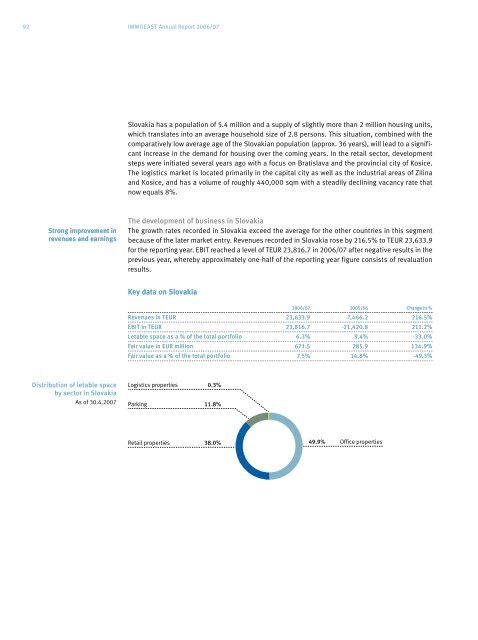
Distribution of letable space<br />
by sector in Slovakia<br />
As of 30.4.20<strong>07</strong><br />
Slovakia has a population of 5.4 million and a supply of slightly more than 2 million housing units,<br />
which translates into an average household size of 2.8 persons. This situation, combined with the<br />
comparatively low average age of the Slovakian population (approx. 36 years), will lead to a significant<br />
increase in the demand for housing over the coming years. In the retail sector, development<br />
steps were initiated several years ago with a focus on Bratislava and the provincial city of Kosice.<br />
The logistics market is located primarily in the capital city as well as the industrial areas of Zilina<br />
and Kosice, and has a volume of roughly 440,000 sqm with a steadily declining vacancy rate that<br />
now equals 8%.<br />
The development of business in Slovakia<br />
The growth rates recorded in Slovakia exceed the average for the other countries in this segment<br />
because of the later market entry. Revenues recorded in Slovakia rose by 216.5% to TEUR 23,633.9<br />
for the reporting year. EBIT reached a level of TEUR 23,816.7 in <strong>2006</strong>/<strong>07</strong> after negative results in the<br />
previous year, whereby approximately one-half of the reporting year figure consists of revaluation<br />
results.<br />
Key data on Slovakia<br />
<strong>2006</strong>/<strong>07</strong> 2005/06 Change in %<br />
Revenues in TEUR 23,633.9 7,466.2 216.5%<br />
EBIT in TEUR 23,816.7 -21,420.8 211.2%<br />
Letable space as a % of the total portfolio 6.3% 9.4% -33.0%<br />
Fair value in EUR million 671.5 285.9 134.9%<br />
Fair value as a % of the total portfolio 7.5% 14.8% -49.3%<br />
Logistics properties 0.3%<br />
Parking 11.8%<br />
Retail properties 38.0% 49.9% Office properties