

IMMOEAST Annual Report 2006/07
IMMOEAST Annual Report 2006/07
IMMOEAST Annual Report 2006/07

Create successful ePaper yourself
Turn your PDF publications into a flip-book with our unique Google optimized e-Paper software.
74 <strong>IMMOEAST</strong> <strong>Annual</strong> <strong>Report</strong> <strong>2006</strong>/<strong>07</strong><br />
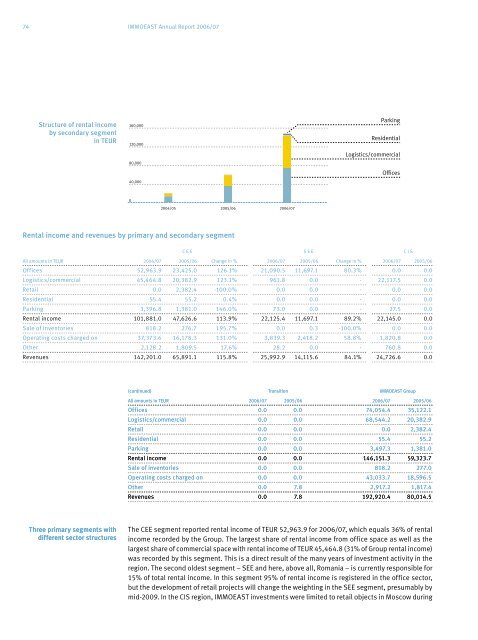
Structure of rental income<br />
by secondary segment<br />
in TEUR<br />
Three primary segments with<br />
different sector structures<br />
160,000<br />
120,000<br />
80,000<br />
40,000<br />
0<br />
2004/05 2005/06 <strong>2006</strong>/<strong>07</strong><br />
Rental income and revenues by primary and secondary segment<br />
Parking<br />
Residential<br />
Logistics/commercial<br />
C E E S E E C I S<br />
All amounts in TEUR <strong>2006</strong>/<strong>07</strong> 2005/06 Change in % <strong>2006</strong>/<strong>07</strong> 2005/06 Change in % <strong>2006</strong>/<strong>07</strong> 2005/06<br />
Offices 52,963.9 23,425.0 126.1% 21,090.5 11,697.1 80.3% 0.0 0.0<br />
Logistics/commercial 45,464.8 20,382.9 123.1% 961.8 0.0 - 22,117.5 0.0<br />
Retail 0.0 2,382.4 -100.0% 0.0 0.0 - 0.0 0.0<br />
Residential 55.4 55.2 0.4% 0.0 0.0 - 0.0 0.0<br />
Parking 3,396.8 1,381.0 146.0% 73.0 0.0 - 27.5 0.0<br />
Rental income 101,881.0 47,626.6 113.9% 22,125.4 11,697.1 89.2% 22,145.0 0.0<br />
Sale of inventories 818.2 276.7 195.7% 0.0 0.3 -100.0% 0.0 0.0<br />
Operating costs charged on 37,373.6 16,178.3 131.0% 3,839.3 2,418.2 58.8% 1,820.8 0.0<br />
Other 2,128.2 1,809.5 17.6% 28.2 0.0 - 760.8 0.0<br />
Revenues 142,201.0 65,891.1 115.8% 25,992.9 14,115.6 84.1% 24,726.6 0.0<br />
Offices<br />
(continued) Transition <strong>IMMOEAST</strong> Group<br />
All amounts in TEUR <strong>2006</strong>/<strong>07</strong> 2005/06 <strong>2006</strong>/<strong>07</strong> 2005/06<br />
Offices 0.0 0.0 74,054.4 35,122.1<br />
Logistics/commercial 0.0 0.0 68,544.2 20,382.9<br />
Retail 0.0 0.0 0.0 2,382.4<br />
Residential 0.0 0.0 55.4 55.2<br />
Parking 0.0 0.0 3,497.3 1,381.0<br />
Rental income 0.0 0.0 146,151.3 59,323.7<br />
Sale of inventories 0.0 0.0 818.2 277.0<br />
Operating costs charged on 0.0 0.0 43,033.7 18,596.5<br />
Other 0.0 7.8 2,917.2 1,817.4<br />
Revenues 0.0 7.8 192,920.4 80,014.5<br />
The CEE segment reported rental income of TEUR 52,963.9 for <strong>2006</strong>/<strong>07</strong>, which equals 36% of rental<br />
income recorded by the Group. The largest share of rental income from office space as well as the<br />
largest share of commercial space with rental income of TEUR 45,464.8 (31% of Group rental income)<br />
was recorded by this segment. This is a direct result of the many years of investment activity in the<br />
region. The second oldest segment – SEE and here, above all, Romania – is currently responsible for<br />
15% of total rental income. In this segment 95% of rental income is registered in the office sector,<br />
but the development of retail projects will change the weighting in the SEE segment, presumably by<br />
mid-2009. In the CIS region, <strong>IMMOEAST</strong> investments were limited to retail objects in Moscow during