

IMMOEAST Annual Report 2006/07
IMMOEAST Annual Report 2006/07
IMMOEAST Annual Report 2006/07

Create successful ePaper yourself
Turn your PDF publications into a flip-book with our unique Google optimized e-Paper software.
190 <strong>IMMOEAST</strong> <strong>Annual</strong> <strong>Report</strong> <strong>2006</strong>/<strong>07</strong><br />
The calculation of EPRA NNNAV is based on the premise that any taxes due in connection with the sale of a property<br />
will reduce EPRA NAV accordingly. The strategy of the company is also reflected in computing the present value of<br />
taxes. For the above calculation, this means that the <strong>IMMOEAST</strong> strategy – which focuses on long-term investments<br />
– does not include the sale of properties, and the present value of the provisions for taxes therefore equals zero. The<br />
current provisions for deferred taxes were only discounted to present value in cases where plans call for the sale of<br />
the property (e.g. in the residential segment).<br />
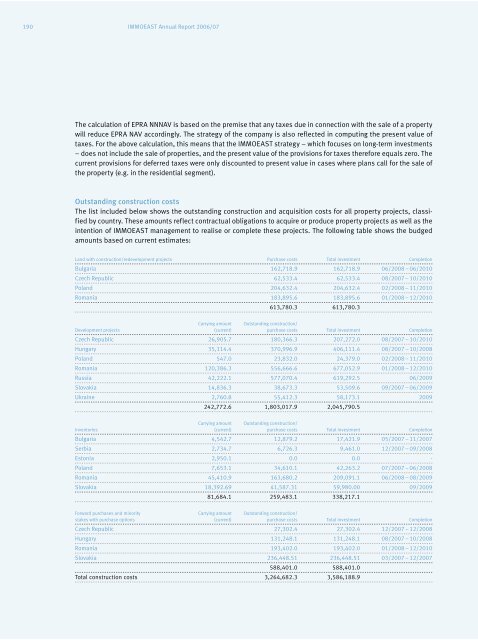
Outstanding construction costs<br />
The list included below shows the outstanding construction and acquisition costs for all property projects, classified<br />
by country. These amounts reflect contractual obligations to acquire or produce property projects as well as the<br />
intention of <strong>IMMOEAST</strong> management to realise or complete these projects. The following table shows the budged<br />
amounts based on current estimates:<br />
Land with construction/redevelopment projects Purchase costs Total investment Completion<br />
Bulgaria 162,718.9 162,718.9 06/2008 – 06/2010<br />
Czech Republic 62,533.4 62,533.4 08/20<strong>07</strong> – 10/2010<br />
Poland 204,632.4 204,632.4 02/2008 – 11/2010<br />
Romania 183,895.6 183,895.6 01/2008 – 12/2010<br />
613,780.3 613,780.3<br />
Carrying amount Outstanding construction/<br />
Development projects (current) purchase costs Total investment Completion<br />
Czech Republic 26,905.7 180,366.3 2<strong>07</strong>,272.0 08/20<strong>07</strong> – 10/2010<br />
Hungary 35,114.4 370,996.9 406,111.4 08/20<strong>07</strong> – 10/2008<br />
Poland 547.0 23,832.0 24,379.0 02/2008 – 11/2010<br />
Romania 120,386.3 556,666.6 677,052.9 01/2008 – 12/2010<br />
Russia 42,222.1 577,<strong>07</strong>0.4 619,292.5 06/2009<br />
Slovakia 14,836.3 38,673.3 53,509.6 09/20<strong>07</strong> – 06/2009<br />
Ukraine 2,760.8 55,412.3 58,173.1 2009<br />
242,772.6 1,803,017.9 2,045,790.5<br />
Carrying amount Outstanding construction/<br />
Inventories (current) purchase costs Total investment Completion<br />
Bulgaria 4,542.7 12,879.2 17,421.9 05/20<strong>07</strong> – 11/20<strong>07</strong><br />
Serbia 2,734.7 6,726.3 9,461.0 12/20<strong>07</strong> – 09/2008<br />
Estonia 2,950.1 0.0 0.0 -<br />
Poland 7,653.1 34,610.1 42,263.2 <strong>07</strong>/20<strong>07</strong> – 06/2008<br />
Romania 45,410.9 163,680.2 209,091.1 06/2008 – 08/2009<br />
Slovakia 18,392.69 41,587.31 59,980.00 09/2009<br />
81,684.1 259,483.1 338,217.1<br />
Forward purchases and minority Carrying amount Outstanding construction/<br />
stakes with purchase options (current) purchase costs Total investment Completion<br />
Czech Republic 27,302.4 27,302.4 12/20<strong>07</strong> – 12/2008<br />
Hungary 131,248.1 131,248.1 08/20<strong>07</strong> – 10/2008<br />
Romania 193,402.0 193,402.0 01/2008 – 12/2010<br />
Slovakia 236,448.51 236,448.51 03/20<strong>07</strong> – 12/20<strong>07</strong><br />
588,401.0 588,401.0<br />
Total construction costs 3,264,682.3 3,586,188.9