

IMMOEAST Annual Report 2006/07
IMMOEAST Annual Report 2006/07
IMMOEAST Annual Report 2006/07

Create successful ePaper yourself
Turn your PDF publications into a flip-book with our unique Google optimized e-Paper software.
6.1.2. Development of business in CEE<br />
Key data on the CEE Segment<br />
<strong>2006</strong>/<strong>07</strong> 2005/06 Change in %<br />
Revenues in TEUR 142,201.0 65,891.1 115.8%<br />
EBIT in TEUR 298,432.5 87,674.8 240.4%<br />
Cash EBIT in TEUR 72,299.0 24,184.0 199.0%<br />
Segment assets in TEUR 2,960,800.9 1,642,033.4 80.3%<br />
Segment liabilities in TEUR 1,810,058.0 1,102,442.9 64.2%<br />
Letable space as a % of the total portfolio 52.2% 84.1% -38.0%<br />
Fair value in EUR million 4,311.7 1,662.6 159.3%<br />
Fair value as a % of the total portfolio 47.8% 86.1% -44.5%<br />
The CEE segment generated an increase of nearly 116% in revenues to TEUR 142,201.0 in <strong>2006</strong>/<strong>07</strong>,<br />
which represents 74% of the total revenues recorded by <strong>IMMOEAST</strong>. Investments in this segment<br />
focus primarily on office properties as well as logistics and commercial objects. EBIT rose by more<br />
than 240% to TEUR 298,432.5 during the reporting year, supported by a further increase in revaluation<br />
results. This development was based primarily on Poland and the Czech Republic. The CEE<br />
segment is responsible for 55% of EBIT in the <strong>IMMOEAST</strong> Group. An increase of nearly 200% in cash<br />
EBIT led to an improvement in the cash EBIT margin from 33.1% to 50.8% during <strong>2006</strong>/<strong>07</strong>.<br />
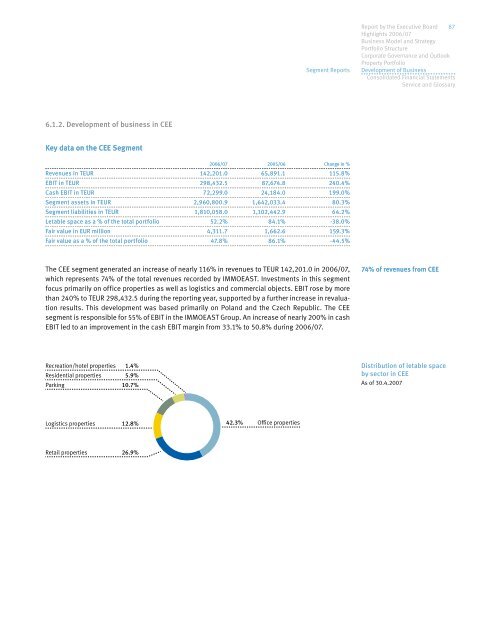
Recreation/hotel properties 1.4%<br />
Residential properties 5.9%<br />
Parking 10.7%<br />
Logistics properties 12.8%<br />
Retail properties 26.9%<br />
42.3% Office properties<br />
Segment <strong>Report</strong>s<br />
<strong>Report</strong> by the Executive Board 87<br />
Highlights <strong>2006</strong>/<strong>07</strong><br />
Business Model and Strategy<br />
Portfolio Structure<br />
Corporate Governance and Outlook<br />
Property Portfolio<br />
Development of Business<br />
Consolidated Financial Statements<br />
Service and Glossary<br />
74% of revenues from CEE<br />
Distribution of letable space<br />
by sector in CEE<br />
As of 30.4.20<strong>07</strong>