

IMMOEAST Annual Report 2006/07
IMMOEAST Annual Report 2006/07
IMMOEAST Annual Report 2006/07

Create successful ePaper yourself
Turn your PDF publications into a flip-book with our unique Google optimized e-Paper software.
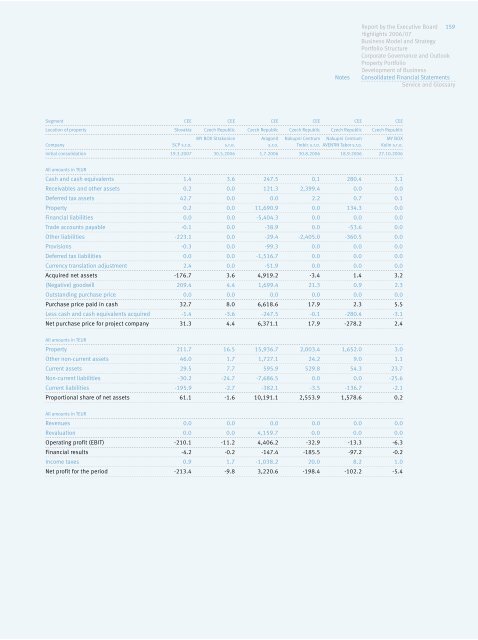
Segment CEE CEE CEE CEE CEE CEE<br />
Location of property Slovakia Czech Republic Czech Republic Czech Republic Czech Republic Czech Republic<br />
MY BOX Strakonice Aragonit Nakupni Centrum Nakupni Centrum MY BOX<br />
Company SCP s.r.o. s.r.o. s.r.o. Trebic s.r.o. AVENTIN Tabor s.r.o. Kolin s.r.o.<br />
Initial consolidation 19.3.20<strong>07</strong> 30.5.<strong>2006</strong> 1.7.<strong>2006</strong> 30.8.<strong>2006</strong> 18.9.<strong>2006</strong> 27.10.<strong>2006</strong><br />
All amounts in TEUR<br />
Cash and cash equivalents 1.4 3.6 247.5 0.1 280.4 3.1<br />
Receivables and other assets 0.2 0.0 121.3 2,399.4 0.0 0.0<br />
Deferred tax assets 42.7 0.0 0.0 2.2 0.7 0.1<br />
Property 0.2 0.0 11,690.9 0.0 134.3 0.0<br />
Financial liabilities 0.0 0.0 -5,404.3 0.0 0.0 0.0<br />
Trade accounts payable -0.1 0.0 -38.9 0.0 -53.6 0.0<br />
Other liabilities -223.1 0.0 -29.4 -2,405.0 -360.5 0.0<br />
Provisions -0.3 0.0 -99.3 0.0 0.0 0.0<br />
Deferred tax liabilities 0.0 0.0 -1,516.7 0.0 0.0 0.0<br />
Currency translation adjustment 2.4 0.0 -51.9 0.0 0.0 0.0<br />
Acquired net assets -176.7 3.6 4,919.2 -3.4 1.4 3.2<br />
(Negative) goodwill 209.4 4.4 1,699.4 21.3 0.9 2.3<br />
Outstanding purchase price 0.0 0.0 0.0 0.0 0.0 0.0<br />
Purchase price paid in cash 32.7 8.0 6,618.6 17.9 2.3 5.5<br />
Less cash and cash equivalents acquired -1.4 -3.6 -247.5 -0.1 -280.4 -3.1<br />
Net purchase price for project company 31.3 4.4 6,371.1 17.9 -278.2 2.4<br />
All amounts in TEUR<br />
Property 211.7 16.5 15,936.7 2,003.4 1,652.0 3.0<br />
Other non-current assets 46.0 1.7 1,727.1 24.2 9.0 1.1<br />
Current assets 29.5 7.7 595.9 529.8 54.3 23.7<br />
Non-current liabilities -30.2 -24.7 -7,686.5 0.0 0.0 -25.6<br />
Current liabilities -195.9 -2.7 -382.1 -3.5 -136.7 -2.1<br />
Proportional share of net assets 61.1 -1.6 10,191.1 2,553.9 1,578.6 0.2<br />
All amounts in TEUR<br />
Revenues 0.0 0.0 0.0 0.0 0.0 0.0<br />
Revaluation 0.0 0.0 4,159.7 0.0 0.0 0.0<br />
Operating profit (EBIT) -210.1 -11.2 4,406.2 -32.9 -13.3 -6.3<br />
Financial results -4.2 -0.2 -147.4 -185.5 -97.2 -0.2<br />
Notes<br />
Income taxes 0.9 1.7 -1,038.2 20.0 8.2 1.0<br />
Net profit for the period -213.4 -9.8 3,220.6 -198.4 -102.2 -5.4<br />
<strong>Report</strong> by the Executive Board 159<br />
Highlights <strong>2006</strong>/<strong>07</strong><br />
Business Model and Strategy<br />
Portfolio Structure<br />
Corporate Governance and Outlook<br />
Property Portfolio<br />
Development of Business<br />
Consolidated Financial Statements<br />
Service and Glossary