

IMMOEAST Annual Report 2006/07
IMMOEAST Annual Report 2006/07
IMMOEAST Annual Report 2006/07

You also want an ePaper? Increase the reach of your titles
YUMPU automatically turns print PDFs into web optimized ePapers that Google loves.
80 <strong>IMMOEAST</strong> <strong>Annual</strong> <strong>Report</strong> <strong>2006</strong>/<strong>07</strong><br />
Improvement of 290%<br />
in financial results<br />
2% effective tax rate<br />
Financial results<br />
Financial results comprise current financing costs (interest income and interest expense) as well<br />
as profit and loss on financial investments and the proportional share of profit and loss from associated<br />
companies. The <strong>2006</strong>/<strong>07</strong> financial year brought an increase of 290% or TEUR 77,487.3 in<br />
financial results to TEUR 104,163.5. This development resulted from the strong expansion of the<br />
Group’s financing activities on behalf of partners and the parent company, which led to the first<br />
clearly positive net financing costs of TEUR 14,131.8. In addition, the investment of surplus liquid<br />
funds from the capital increase and the valuation of financial instruments generated TEUR 48,429.7<br />
in <strong>2006</strong>/<strong>07</strong> compared with TEUR 14,680.3 in the prior year. Distributions from financial instruments<br />
held by <strong>IMMOEAST</strong> totalled TEUR 5,422.2. Exchange rate gains and losses equalled TEUR 34,356.6<br />
in <strong>2006</strong>/<strong>07</strong> compared with TEUR 11,141.5 in 2005/06.<br />
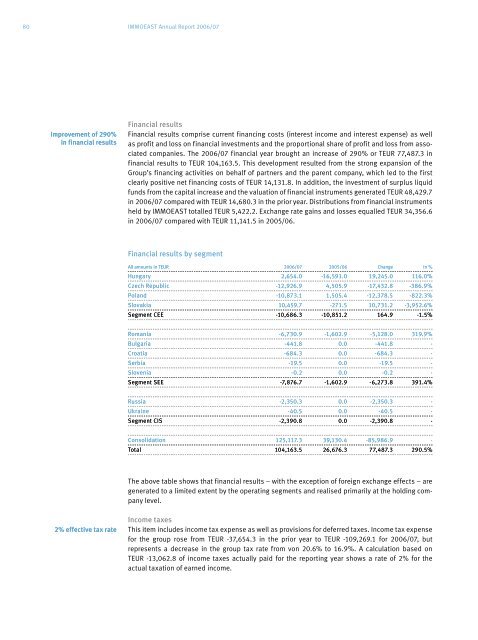
Financial results by segment<br />
All amounts in TEUR <strong>2006</strong>/<strong>07</strong> 2005/06 Change in %<br />
Hungary 2,654.0 -16,591.0 19,245.0 116.0%<br />
Czech Republic -12,926.9 4,505.9 -17,432.8 -386.9%<br />
Poland -10,873.1 1,505.4 -12,378.5 -822.3%<br />
Slovakia 10,459.7 -271.5 10,731.2 -3,952.6%<br />
Segment CEE -10,686.3 -10,851.2 164.9 -1.5%<br />
Romania -6,730.9 -1,602.9 -5,128.0 319.9%<br />
Bulgaria -441.8 0.0 -441.8 -<br />
Croatia -684.3 0.0 -684.3 -<br />
Serbia -19.5 0.0 -19.5 -<br />
Slovenia -0.2 0.0 -0.2 -<br />
Segment SEE -7,876.7 -1,602.9 -6,273.8 391.4%<br />
Russia -2,350.3 0.0 -2,350.3 -<br />
Ukraine -40.5 0.0 -40.5 -<br />
Segment CIS -2,390.8 0.0 -2,390.8 -<br />
Consolidation 125,117.3 39,130.4 -85,986.9 -<br />
Total 104,163.5 26,676.3 77,487.3 290.5%<br />
The above table shows that financial results – with the exception of foreign exchange effects – are<br />
generated to a limited extent by the operating segments and realised primarily at the holding company<br />
level.<br />
Income taxes<br />
This item includes income tax expense as well as provisions for deferred taxes. Income tax expense<br />
for the group rose from TEUR -37,654.3 in the prior year to TEUR -109,269.1 for <strong>2006</strong>/<strong>07</strong>, but<br />
represents a decrease in the group tax rate from von 20.6% to 16.9%. A calculation based on<br />
TEUR -13,062.8 of income taxes actually paid for the reporting year shows a rate of 2% for the<br />
actual taxation of earned income.