

IMMOEAST Annual Report 2006/07
IMMOEAST Annual Report 2006/07
IMMOEAST Annual Report 2006/07

You also want an ePaper? Increase the reach of your titles
YUMPU automatically turns print PDFs into web optimized ePapers that Google loves.
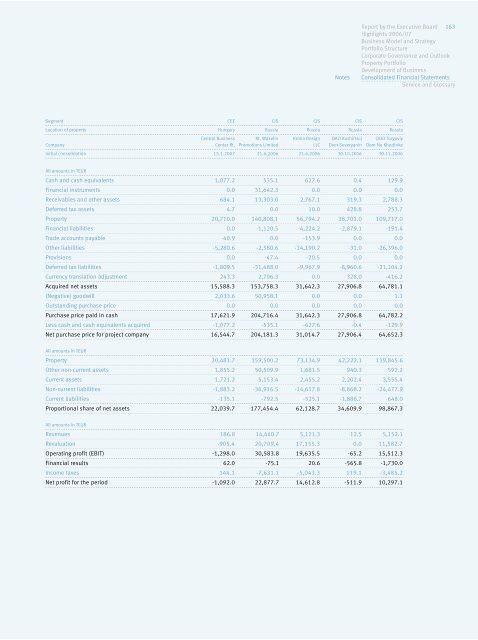
Segment CEE CIS CIS CIS CIS<br />
Location of property Hungary Russia Russia Russia Russia<br />
Central Business Rt. Wakelin Krona Design OAO Kashirskij OOO Torgoviy<br />
Company Center Rt. Promotions Limited LLC Dvor-Severyanin Dom Na Khodinke<br />
Initial consolidation 15.1.20<strong>07</strong> 21.6.<strong>2006</strong> 21.6.<strong>2006</strong> 30.10.<strong>2006</strong> 30.11.<strong>2006</strong><br />
All amounts in TEUR<br />
Cash and cash equivalents 1,<strong>07</strong>7.2 535.1 627.6 0.4 129.9<br />
Financial instruments 0.0 31,642.3 0.0 0.0 0.0<br />
Receivables and other assets 684.1 13,303.0 2,767.1 319.3 2,788.3<br />
Deferred tax assets 4.7 0.0 10.0 428.8 253.7<br />
Property 20,710.0 140,808.1 56,794.2 38,701.0 109,717.0<br />
Financial liabilities 0.0 -1,120.5 -4,224.2 -2,879.1 -191.4<br />
Trade accounts payable -40.9 0.0 -153.9 0.0 0.0<br />
Other liabilities -5,280.6 -2,580.6 -14,190.2 -31.0 -26,396.0<br />
Provisions 0.0 -47.4 -20.5 0.0 0.0<br />
Deferred tax liabilities -1,809.5 -31,488.0 -9,967.9 -8,960.6 -21,104.2<br />
Currency translation adjustment 243.3 2,706.3 0.0 328.0 -416.2<br />
Acquired net assets 15,588.3 153,758.3 31,642.3 27,906.8 64,781.1<br />
(Negative) goodwill 2,033.6 50,958.1 0.0 0.0 1.1<br />
Outstanding purchase price 0.0 0.0 0.0 0.0 0.0<br />
Purchase price paid in cash 17,621.9 204,716.4 31,642.3 27,906.8 64,782.2<br />
Less cash and cash equivalents acquired -1,<strong>07</strong>7.2 -535.1 -627.6 -0.4 -129.9<br />
Net purchase price for project company 16,544.7 204,181.3 31,014.7 27,906.4 64,652.3<br />
All amounts in TEUR<br />
Property 20,481.7 159,500.2 73,134.9 42,222.1 119,845.6<br />
Other non-current assets 1,855.2 50,509.9 1,681.5 940.3 592.2<br />
Current assets 1,721.2 5,153.4 2,455.2 2,202.4 3,555.4<br />
Non-current liabilities -1,883.2 -36,916.5 -14,617.8 -8,868.2 -24,477.9<br />
Current liabilities -135.1 -792.5 -525.1 -1,886.7 -648.0<br />
Proportional share of net assets 22,039.7 177,454.4 62,128.7 34,609.9 98,867.3<br />
All amounts in TEUR<br />
Revenues 186.8 14,440.7 5,121.3 12.5 5,152.1<br />
Revaluation -905.4 20,709.4 17,155.3 0.0 11,582.7<br />
Operating profit (EBIT) -1,298.0 30,583.8 19,635.5 -65.2 15,512.3<br />
Financial results 62.0 -75.1 20.6 -565.8 -1,730.0<br />
Notes<br />
Income taxes 144.1 -7,631.1 -5,043.3 119.1 -3,485.2<br />
Net profit for the period -1,092.0 22,877.7 14,612.8 -511.9 10,297.1<br />
<strong>Report</strong> by the Executive Board 163<br />
Highlights <strong>2006</strong>/<strong>07</strong><br />
Business Model and Strategy<br />
Portfolio Structure<br />
Corporate Governance and Outlook<br />
Property Portfolio<br />
Development of Business<br />
Consolidated Financial Statements<br />
Service and Glossary