

IMMOEAST Annual Report 2006/07
IMMOEAST Annual Report 2006/07
IMMOEAST Annual Report 2006/07

You also want an ePaper? Increase the reach of your titles
YUMPU automatically turns print PDFs into web optimized ePapers that Google loves.
The SEE segment generated TEUR 223,150.8 or 41% of Group EBIT in <strong>2006</strong>/<strong>07</strong>. This development<br />
was supported above all by Romania (TEUR 128,009.7) and Bulgaria (TEUR 78,740.4). Only Serbia<br />
reported negative EBIT of TEUR -259.0, which resulted from impairment charges to goodwill.<br />
The first contribution by the new CIS segment to Group EBIT totalled TEUR 49,193.9 or 9%. EBIT<br />
reported by Ukraine was negative because of an impairment charge recognised to goodwill in the<br />
Alacor Group.<br />
Cash EBIT totalled TEUR 65,383.6 for the <strong>2006</strong>/<strong>07</strong> financial year.<br />
Results for <strong>2006</strong>/<strong>07</strong><br />
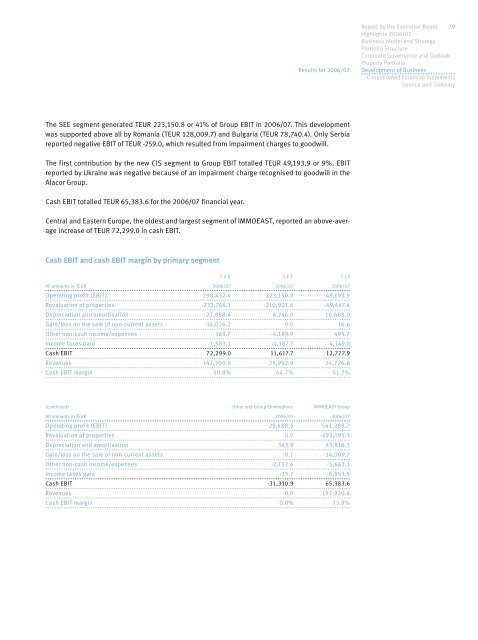
Central and Eastern Europe, the oldest and largest segment of <strong>IMMOEAST</strong>, reported an above-average<br />
increase of TEUR 72,299.0 in cash EBIT.<br />
Cash EBIT and cash EBIT margin by primary segment<br />
C E E S E E C I S<br />
All amounts in TEUR <strong>2006</strong>/<strong>07</strong> <strong>2006</strong>/<strong>07</strong> <strong>2006</strong>/<strong>07</strong><br />
Operating profit (EBIT) 298,432.4 223,150.8 49,193.9<br />
Revaluation of properties -232,746.1 -210,901.6 -49,447.4<br />
Depreciation and amortisation 22,058.4 4,746.0 16,668.0<br />
Gain/loss on the sale of non-current assets -14,026.2 0.0 16.6<br />
Other non-cash income/expenses 163.7 -4,189.9 495.7<br />
Income taxes paid -1,583.1 -1,187.7 -4,149.0<br />
Cash EBIT 72,299.0 11,617.7 12,777.9<br />
Revenues 142,200.9 25,992.9 24,726.6<br />
Cash EBIT margin 50.8% 44.7% 51.7%<br />
(continued) Other and Group Eliminations <strong>IMMOEAST</strong> Group<br />
All amounts in TEUR <strong>2006</strong>/<strong>07</strong> <strong>2006</strong>/<strong>07</strong><br />
Operating profit (EBIT) -29,488.5 541,288.7<br />
Revaluation of properties 0.0 -493,095.1<br />
Depreciation and amortisation 343.9 43,816.3<br />
Gain/loss on the sale of non-current assets -0.1 -14,009.7<br />
Other non-cash income/expenses -2,132.6 -5,663.1<br />
Income taxes paid -33.7 -6,953.5<br />
Cash EBIT -31,310.9 65,383.6<br />
Revenues 0.0 192,920.4<br />
Cash EBIT margin 0.0% 33.9%<br />
<strong>Report</strong> by the Executive Board 79<br />
Highlights <strong>2006</strong>/<strong>07</strong><br />
Business Model and Strategy<br />
Portfolio Structure<br />
Corporate Governance and Outlook<br />
Property Portfolio<br />
Development of Business<br />
Consolidated Financial Statements<br />
Service and Glossary