Las PYME españolas con forma societaria - Dirección General de ...
Las PYME españolas con forma societaria - Dirección General de ...
Las PYME españolas con forma societaria - Dirección General de ...

Create successful ePaper yourself
Turn your PDF publications into a flip-book with our unique Google optimized e-Paper software.
LAS <strong>PYME</strong> ESPAÑOLAS CON FORMA SOCIETARIA<br />
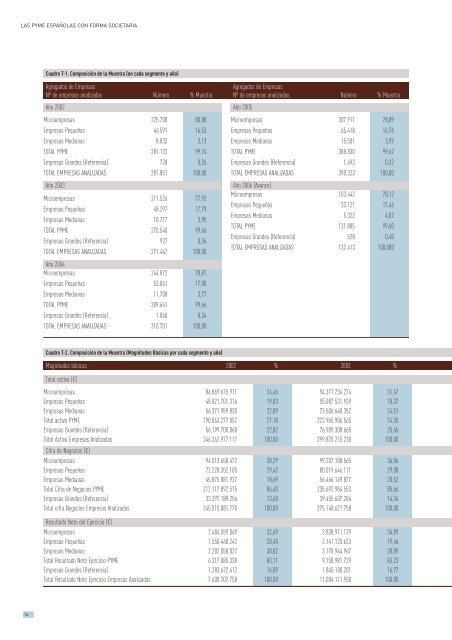
Cuadro T-1. Composición <strong>de</strong> la Muestra (en cada segmento y año)<br />
Agregados <strong>de</strong> Empresas<br />
Nº <strong>de</strong> empresas analizadas Número % Muestra<br />
Año 2002<br />
Microempresas 225.700 80,08<br />
Empresas Pequeñas 46.591 16,53<br />
Empresas Medianas 8.832 3,13<br />
TOTAL <strong>PYME</strong> 281.123 99,74<br />
Empresas Gran<strong>de</strong>s (Referencia) 728 0,26<br />
TOTAL EMPRESAS ANALIZADAS 281.851 100,00<br />
Año 2003<br />
Microempresas 211.526 77,92<br />
Empresas Pequeñas 48.297 17,79<br />
Empresas Medianas 10.717 3,95<br />
TOTAL <strong>PYME</strong> 270.540 99,66<br />
Empresas Gran<strong>de</strong>s (Referencia) 927 0,34<br />
TOTAL EMPRESAS ANALIZADAS 271.467 100,00<br />
Año 2004<br />
Microempresas 244.872 78,81<br />
Empresas Pequeñas 53.061 17,08<br />
Empresas Medianas 11.708 3,77<br />
TOTAL <strong>PYME</strong> 309.641 99,66<br />
Empresas Gran<strong>de</strong>s (Referencia) 1.060 0,34<br />
TOTAL EMPRESAS ANALIZADAS 310.701 100,00<br />
Agregados <strong>de</strong> Empresas<br />
Nº <strong>de</strong> empresas analizadas Número % Muestra<br />
Año 2005<br />
Microempresas 307.911 78,89<br />
Empresas Pequeñas 65.418 16,76<br />
Empresas Medianas 15.501 3,97<br />
TOTAL <strong>PYME</strong> 388.830 99,62<br />
Empresas Gran<strong>de</strong>s (Referencia) 1.493 0,32<br />
TOTAL EMPRESAS ANALIZADAS 390.323 100,00<br />
Año 2006 (Avance)<br />
Microempresas 103.442 78,12<br />
Empresas Pequeñas 23.121 17,46<br />
Empresas Medianas 5.322 4,02<br />
TOTAL <strong>PYME</strong> 131.885 99,60<br />
Empresas Gran<strong>de</strong>s (Referencia) 528 0,40<br />
TOTAL EMPRESAS ANALIZADAS 132.413 100,000<br />
Cuadro T-2. Composición <strong>de</strong> la Muestra (Magnitu<strong>de</strong>s Básicas por cada segmento y año)<br />
Magnitu<strong>de</strong>s básicas 2002 % 2003 %<br />
Total activo (€)<br />
Microempresas 84.869.615.911 34,46 94.371.734.274 31,47<br />
Empresas Pequeñas 48.821.701.316 19,83 55.087.531.939 18,37<br />
Empresas Medianas 56.371.959.830 22,89 73.506.640.352 24,51<br />
Total activo <strong>PYME</strong> 190.063.277.057 77,18 222.965.906.565 74,35<br />
Empresas Gran<strong>de</strong>s (Referencia) 56.199.700.060 22,82 76.909.308.665 25,65<br />
Total Activo Empresas Analizadas 246.262.977.117 100,00 299.875.215.230 100,00<br />
Cifra <strong>de</strong> Negocios (€)<br />
Microempresas 94.013.658.472 38,29 99.207.188.565 36,06<br />
Empresas Pequeñas 72.228.352.105 29,42 80.019.646.111 29,08<br />
Empresas Medianas 45.875.881.937 18,69 56.466.149.877 20,52<br />
Total Cifra <strong>de</strong> Negocios <strong>PYME</strong> 212.117.892.515 86,40 235.692.984.553 85,66<br />
Empresas Gran<strong>de</strong>s (Referencia) 33.397.189.256 13,60 39.455.637.204 14,34<br />
Total cifra Negocios Empresas Analizadas 245.515.081.770 100,00 275.148.621.758 100,00<br />
Resultado Neto <strong>de</strong>l Ejercicio (€)<br />
Microempresas 2.484.559.069 32,69 3.838.911.129 34,89<br />
Empresas Pequeñas 1.550.468.242 20,40 2.141.125.633 19,46<br />
Empresas Medianas 2.282.058.027 30,02 3.178.944.967 28,89<br />
Total Resultado Neto Ejercicio <strong>PYME</strong> 6.317.085.338 83,11 9.158.981.729 83,23<br />
Empresas Gran<strong>de</strong>s (Referencia) 1.283.622.412 16,89 1.845.130.201 16,77<br />
Total Resultado Neto Ejercicio Empresas Analizadas 7.600.707.750 100,00 11.004.111.930 100,00<br />
14