Las PYME españolas con forma societaria - Dirección General de ...
Las PYME españolas con forma societaria - Dirección General de ...
Las PYME españolas con forma societaria - Dirección General de ...

Create successful ePaper yourself
Turn your PDF publications into a flip-book with our unique Google optimized e-Paper software.
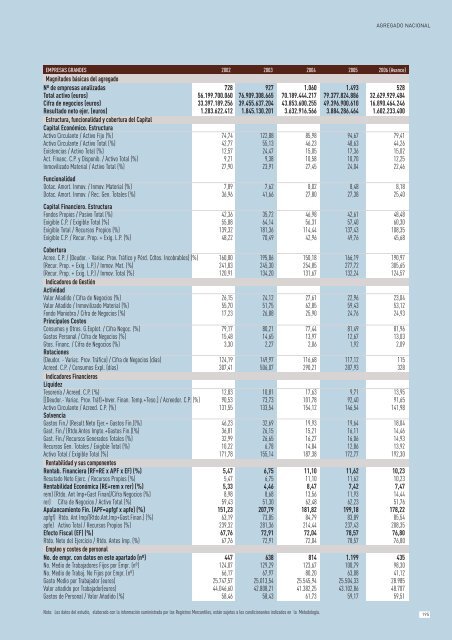
AGREGADO NACIONAL<br />
EMPRESAS GRANDES 2002 2003 2004 2005 2006 (Avance)<br />
Magnitu<strong>de</strong>s básicas <strong>de</strong>l agregado<br />
Nº <strong>de</strong> empresas analizadas 728 927 1.060 1.493 528<br />
Total activo (euros) 56.199.700.060 76.909.308.665 70.189.444.217 79.377.824.886 32.629.929.484<br />
Cifra <strong>de</strong> negocios (euros) 33.397.189.256 39.455.637.204 43.853.600.255 49.396.900.610 16.890.464.246<br />
Resultado neto ejer. (euros) 1.283.622.412 1.845.130.201 3.632.916.566 3.884.286.464 1.602.233.400<br />
Estructura, funcionalidad y cobertura <strong>de</strong>l Capital<br />
Capital E<strong>con</strong>ómico. Estructura<br />
Activo Circulante / Activo Fijo (%) 74,74 122,88 85,98 94,67 79,41<br />
Activo Circulante / Activo Total (%) 42,77 55,13 46,23 48,63 44,26<br />
Existencias / Activo Total (%) 12,57 24,47 15,05 17,36 15,02<br />
Act. Financ. C.P. y Disponib. / Activo Total (%) 9,21 9,38 10,58 10,70 12,25<br />
Inmovilizado Material / Activo Total (%) 27,90 23,91 27,45 24,04 22,46<br />
Funcionalidad<br />
Dotac. Amort. Inmov. / Inmov. Material (%) 7,89 7,62 8,02 8,48 8,18<br />
Dotac. Amort. Inmov. / Rec. Gen. Totales (%) 36,96 41,66 27,80 27,38 25,40<br />
Capital Financiero. Estructura<br />
Fondos Propios / Pasivo Total (%) 42,36 35,72 46,98 42,61 48,48<br />
Exigible C.P. / Exigible Total (%) 55,88 64,14 56,31 57,40 60,30<br />
Exigible Total / Recursos Propios (%) 139,32 181,36 114,44 137,43 108,35<br />
Exigible C.P. / Recur. Prop. + Exig. L.P. (%) 48,22 70,49 42,96 49,76 45,68<br />
Cobertura<br />
Acree. C.P. / (Deudor. - Variac. Prov. Tráfico y Pérd. Cdtos. Incobrables) (%) 160,80 195,86 150,18 166,19 190,97<br />
(Recur. Prop. + Exig. L.P.) / Inmov. Mat. (%) 241,83 245,30 254,85 277,72 305,65<br />
(Recur. Prop. + Exig. L.P.) / Inmov. Total (%) 120,91 134,20 131,67 132,24 124,57<br />
Indicadores <strong>de</strong> Gestión<br />
Actividad<br />
Valor Añadido / Cifra <strong>de</strong> Negocios (%) 26,15 24,12 27,61 22,96 23,04<br />
Valor Añadido / Inmovilizado Material (%) 55,70 51,75 62,85 59,43 53,12<br />
Fondo Maniobra / Cifra <strong>de</strong> Negocios (%) 17,23 26,88 25,90 24,76 24,93<br />
Principales Costes<br />
Consumos y Otros. G.Explot. / Cifra Negoc. (%) 79,17 80,21 77,44 81,49 81,96<br />
Gastos Personal / Cifra <strong>de</strong> Negocios (%) 15,48 14,65 13,97 12,67 13,03<br />
Gtos. Financ. / Cifra <strong>de</strong> Negocios (%) 3,30 2,27 2,06 1,92 2,09<br />
Rotaciones<br />
(Deudor. - Variac. Prov. Tráfico) / Cifra <strong>de</strong> Negocios (días) 124,19 149,97 116,68 117,12 115<br />
Acreed. C.P. / Consumos Expl. (días) 307,41 506,07 290,21 287,93 328<br />
Indicadores Financieros<br />
Liqui<strong>de</strong>z<br />
Tesorería / Acreed. C.P. (%) 12,83 10,81 17,63 9,71 13,95<br />
[(Deudor.- Variac. Prov. Tráf)+Inver. Finan. Temp.+Teso.] / Acreedor. C.P. (%) 90,53 73,73 101,78 92,40 91,65<br />
Activo Circulante / Acreed. C.P. (%) 131,55 133,54 154,12 146,54 141,98<br />
Solvencia<br />
Gastos Fin./ (Result.Neto Ejer.+ Gastos Fin.)(%) 46,23 32,69 19,93 19,64 18,04<br />
Gast. Fin./ (Rtdo.Antes Impto.+Gastos Fin.)(%) 36,81 26,15 15,21 16,11 14,46<br />
Gast. Fin./ Recursos Generados Totales (%) 32,99 26,65 16,27 16,06 14,93<br />
Recursos Gen. Totales / Exigible Total (%) 10,22 6,78 14,84 12,86 13,92<br />
Activo Total / Exigible Total (%) 171,78 155,14 187,38 172,77 192,30<br />
Rentabilidad y sus componentes<br />
Rentab. Financiera (RF=RE x APF x EF) (%) 5,47 6,75 11,10 11,62 10,23<br />
Resutado Neto Ejerc. / Recursos Propios (%) 5,47 6,75 11,10 11,62 10,23<br />
Rentabilidad E<strong>con</strong>ómica (RE=rem x rer) (%) 5,33 4,46 8,47 7,42 7,47<br />
rem) (Rtdo. Ant Imp+Gast Finan)/Cifra Negocios (%) 8,98 8,68 13,56 11,93 14,44<br />
rer) Cifra <strong>de</strong> Negocios / Activo Total (%) 59,43 51,30 62,48 62,23 51,76<br />
Apalancamiento Fin. (APF=apfgf x apfe) (%) 151,23 207,79 181,82 199,18 178,22<br />
apfgf) Rtdo. Ant Imp/(Rtdo.Ant.Imp+Gast.Finan.) (%) 63,19 73,85 84,79 83,89 85,54<br />
apfe) Activo Total / Recursos Propios (%) 239,32 281,36 214,44 237,43 208,35<br />
Efecto Fiscal (EF) (%) 67,76 72,91 72,04 78,57 76,80<br />
Rtdo. Neto <strong>de</strong>l Ejercicio / Rtdo. Antes Imp. (%) 67,76 72,91 72,04 78,57 76,80<br />
Empleo y costes <strong>de</strong> personal<br />
No. <strong>de</strong> empr. <strong>con</strong> datos en este apartado (nº) 447 638 814 1.199 435<br />
No. Medio <strong>de</strong> Trabajadores Fijos por Empr. (nº) 124,07 129,29 123,67 100,79 98,30<br />
No. Medio <strong>de</strong> Trabaj. No Fijos por Empr. (nº) 66,17 67,97 80,20 63,08 41,12<br />
Gasto Medio por Trabajador (euros) 25.747,57 25.013,54 25.545,94 25.504,33 28.985<br />
Valor añadido por Trabajador(euros) 44.046,60 42.808,21 41.382,25 43.102,86 48.707<br />
Gastos <strong>de</strong> Personal / Valor Añadido (%) 58,46 58,43 61,73 59,17 59,51<br />
Nota: Los datos <strong>de</strong>l estudio, elaborado <strong>con</strong> la in<strong>forma</strong>ción suministrada por los Registros Mercantiles, están sujetos a los <strong>con</strong>dicionantes indicados en la Metodologia.<br />
195