Las PYME españolas con forma societaria - Dirección General de ...
Las PYME españolas con forma societaria - Dirección General de ...
Las PYME españolas con forma societaria - Dirección General de ...

Create successful ePaper yourself
Turn your PDF publications into a flip-book with our unique Google optimized e-Paper software.
LAS <strong>PYME</strong> ESPAÑOLAS CON FORMA SOCIETARIA<br />
250<br />
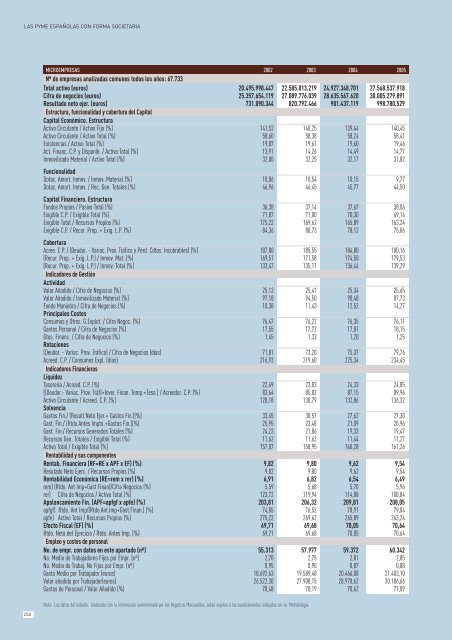
MICROEMPRESAS 2002 2003 2004 2005<br />
Nº <strong>de</strong> empresas analizadas comunes todos los años: 67.733<br />
Total activo (euros) 20.495.998.447 22.585.813.219 24.927.348.701 27.568.537.918<br />
Cifra <strong>de</strong> negocios (euros) 25.357.654.119 27.089.776.039 28.635.567.620 30.005.279.891<br />
Resultado neto ejer. (euros) 731.090.344 820.792.466 901.437.119 998.780.529<br />
Estructura, funcionalidad y cobertura <strong>de</strong>l Capital<br />
Capital E<strong>con</strong>ómico. Estructura<br />
Activo Circulante / Activo Fijo (%) 141,52 140,25 139,44 140,45<br />
Activo Circulante / Activo Total (%) 58,60 58,38 58,24 58,41<br />
Existencias / Activo Total (%) 19,87 19,61 19,60 19,46<br />
Act. Financ. C.P. y Disponib. / Activo Total (%) 13,91 14,26 14,49 14,77<br />
Inmovilizado Material / Activo Total (%) 32,00 32,25 32,17 31,82<br />
Funcionalidad<br />
Dotac. Amort. Inmov. / Inmov. Material (%) 10,86 10,54 10,15 9,77<br />
Dotac. Amort. Inmov. / Rec. Gen. Totales (%) 46,96 46,45 45,77 44,50<br />
Capital Financiero. Estructura<br />
Fondos Propios / Pasivo Total (%) 36,38 37,14 37,67 38,06<br />
Exigible C.P. / Exigible Total (%) 71,87 71,00 70,30 69,14<br />
Exigible Total / Recursos Propios (%) 175,22 169,62 165,89 163,24<br />
Exigible C.P. / Recur. Prop. + Exig. L.P. (%) 84,36 80,73 78,12 75,06<br />
Cobertura<br />
Acree. C.P. / (Deudor. - Variac. Prov. Tráfico y Pérd. Cdtos. Incobrables) (%) 187,80 185,55 184,80 180,16<br />
(Recur. Prop. + Exig. L.P.) / Inmov. Mat. (%) 169,51 171,58 174,50 179,53<br />
(Recur. Prop. + Exig. L.P.) / Inmov. Total (%) 133,47 135,11 136,44 139,29<br />
Indicadores <strong>de</strong> Gestión<br />
Actividad<br />
Valor Añadido / Cifra <strong>de</strong> Negocios (%) 25,13 25,41 25,34 25,65<br />
Valor Añadido / Inmovilizado Material (%) 97,18 94,50 90,48 87,73<br />
Fondo Maniobra / Cifra <strong>de</strong> Negocios (%) 10,38 11,43 12,52 14,27<br />
Principales Costes<br />
Consumos y Otros. G.Explot. / Cifra Negoc. (%) 76,47 76,22 76,35 76,11<br />
Gastos Personal / Cifra <strong>de</strong> Negocios (%) 17,55 17,72 17,81 18,15<br />
Gtos. Financ. / Cifra <strong>de</strong> Negocios (%) 1,45 1,33 1,20 1,25<br />
Rotaciones<br />
(Deudor. - Variac. Prov. Tráfico) / Cifra <strong>de</strong> Negocios (días) 71,81 73,20 75,37 79,76<br />
Acreed. C.P. / Consumos Expl. (días) 216,93 219,60 225,34 234,45<br />
Indicadores Financieros<br />
Liqui<strong>de</strong>z<br />
Tesorería / Acreed. C.P. (%) 22,49 23,83 24,33 24,85<br />
[(Deudor.- Variac. Prov. Tráf)+Inver. Finan. Temp.+Teso.] / Acreedor. C.P. (%) 83,64 85,82 87,15 89,96<br />
Activo Circulante / Acreed. C.P. (%) 128,18 130,79 132,86 136,32<br />
Solvencia<br />
Gastos Fin./ (Result.Neto Ejer.+ Gastos Fin.)(%) 33,45 30,57 27,62 27,30<br />
Gast. Fin./ (Rtdo.Antes Impto.+Gastos Fin.)(%) 25,95 23,48 21,09 20,96<br />
Gast. Fin./ Recursos Generados Totales (%) 24,23 21,86 19,33 19,47<br />
Recursos Gen. Totales / Exigible Total (%) 11,62 11,63 11,44 11,27<br />
Activo Total / Exigible Total (%) 157,07 158,95 160,28 161,26<br />
Rentabilidad y sus componentes<br />
Rentab. Financiera (RF=RE x APF x EF) (%) 9,82 9,80 9,62 9,54<br />
Resutado Neto Ejerc. / Recursos Propios (%) 9,82 9,80 9,62 9,54<br />
Rentabilidad E<strong>con</strong>ómica (RE=rem x rer) (%) 6,91 6,82 6,54 6,49<br />
rem) (Rtdo. Ant Imp+Gast Finan)/Cifra Negocios (%) 5,59 5,68 5,70 5,96<br />
rer) Cifra <strong>de</strong> Negocios / Activo Total (%) 123,72 119,94 114,88 108,84<br />
Apalancamiento Fin. (APF=apfgf x apfe) (%) 203,81 206,32 209,81 208,05<br />
apfgf) Rtdo. Ant Imp/(Rtdo.Ant.Imp+Gast.Finan.) (%) 74,05 76,52 78,91 79,04<br />
apfe) Activo Total / Recursos Propios (%) 275,22 269,62 265,89 263,24<br />
Efecto Fiscal (EF) (%) 69,71 69,68 70,05 70,64<br />
Rtdo. Neto <strong>de</strong>l Ejercicio / Rtdo. Antes Imp. (%) 69,71 69,68 70,05 70,64<br />
Empleo y costes <strong>de</strong> personal<br />
No. <strong>de</strong> empr. <strong>con</strong> datos en este apartado (nº) 55.313 57.977 59.372 60.342<br />
No. Medio <strong>de</strong> Trabajadores Fijos por Empr. (nº) 2,70 2,75 2,81 2,85<br />
No. Medio <strong>de</strong> Trabaj. No Fijos por Empr. (nº) 0,95 0,90 0,87 0,88<br />
Gasto Medio por Trabajador (euros) 18.692,63 19.589,48 20.466,08 21.403,10<br />
Valor añadido por Trabajador(euros) 26.522,30 27.908,15 28.978,62 30.106,66<br />
Gastos <strong>de</strong> Personal / Valor Añadido (%) 70,48 70,19 70,62 71,09<br />
Nota: Los datos <strong>de</strong>l estudio, elaborado <strong>con</strong> la in<strong>forma</strong>ción suministrada por los Registros Mercantiles, están sujetos a los <strong>con</strong>dicionantes indicados en la Metodologia.