Las PYME españolas con forma societaria - Dirección General de ...
Las PYME españolas con forma societaria - Dirección General de ...
Las PYME españolas con forma societaria - Dirección General de ...

Create successful ePaper yourself
Turn your PDF publications into a flip-book with our unique Google optimized e-Paper software.
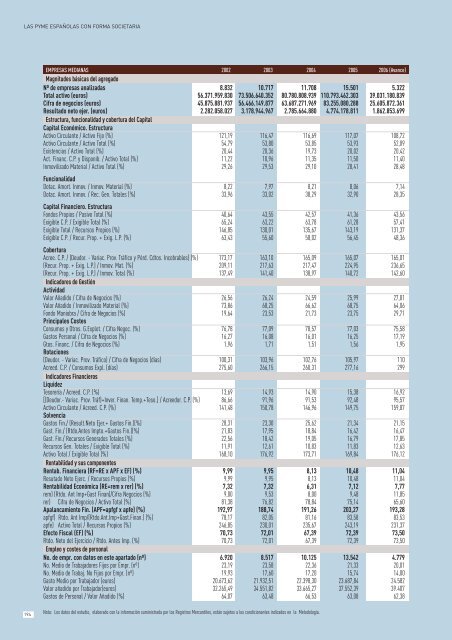
LAS <strong>PYME</strong> ESPAÑOLAS CON FORMA SOCIETARIA<br />
EMPRESAS MEDIANAS 2002 2003 2004 2005 2006 (Avance)<br />
Magnitu<strong>de</strong>s básicas <strong>de</strong>l agregado<br />
Nº <strong>de</strong> empresas analizadas 8.832 10.717 11.708 15.501 5.322<br />
Total activo (euros) 56.371.959.830 73.506.640.352 80.780.808.939 110.793.462.303 39.031.180.839<br />
Cifra <strong>de</strong> negocios (euros) 45.875.881.937 56.466.149.877 63.687.271.969 83.255.080.288 25.605.872.361<br />
Resultado neto ejer. (euros) 2.282.058.027 3.178.944.967 2.785.664.880 4.774.178.811 1.862.853.699<br />
Estructura, funcionalidad y cobertura <strong>de</strong>l Capital<br />
Capital E<strong>con</strong>ómico. Estructura<br />
Activo Circulante / Activo Fijo (%) 121,19 116,47 116,69 117,07 108,72<br />
Activo Circulante / Activo Total (%) 54,79 53,80 53,85 53,93 52,09<br />
Existencias / Activo Total (%) 20,44 20,36 19,73 20,02 20,42<br />
Act. Financ. C.P. y Disponib. / Activo Total (%) 11,22 10,96 11,35 11,50 11,40<br />
Inmovilizado Material / Activo Total (%) 29,26 29,53 29,10 28,41 28,48<br />
Funcionalidad<br />
Dotac. Amort. Inmov. / Inmov. Material (%) 8,22 7,97 8,21 8,06 7,14<br />
Dotac. Amort. Inmov. / Rec. Gen. Totales (%) 33,96 33,02 38,29 32,90 28,35<br />
Capital Financiero. Estructura<br />
Fondos Propios / Pasivo Total (%) 40,64 43,55 42,57 41,36 43,56<br />
Exigible C.P. / Exigible Total (%) 65,24 63,22 63,78 61,28 57,41<br />
Exigible Total / Recursos Propios (%) 146,85 130,01 135,67 143,19 131,37<br />
Exigible C.P. / Recur. Prop. + Exig. L.P. (%) 63,43 55,60 58,02 56,45 48,36<br />
Cobertura<br />
Acree. C.P. / (Deudor. - Variac. Prov. Tráfico y Pérd. Cdtos. Incobrables) (%) 173,17 163,10 165,09 165,07 165,01<br />
(Recur. Prop. + Exig. L.P.) / Inmov. Mat. (%) 209,11 217,63 217,47 224,95 236,65<br />
(Recur. Prop. + Exig. L.P.) / Inmov. Total (%) 137,49 141,40 138,97 140,72 142,60<br />
Indicadores <strong>de</strong> Gestión<br />
Actividad<br />
Valor Añadido / Cifra <strong>de</strong> Negocios (%) 26,56 26,24 24,59 25,99 27,81<br />
Valor Añadido / Inmovilizado Material (%) 73,86 68,25 66,62 68,75 64,06<br />
Fondo Maniobra / Cifra <strong>de</strong> Negocios (%) 19,64 23,53 21,73 23,75 29,71<br />
Principales Costes<br />
Consumos y Otros. G.Explot. / Cifra Negoc. (%) 76,78 77,09 78,57 77,03 75,58<br />
Gastos Personal / Cifra <strong>de</strong> Negocios (%) 16,27 16,08 16,01 16,25 17,19<br />
Gtos. Financ. / Cifra <strong>de</strong> Negocios (%) 1,96 1,71 1,51 1,56 1,95<br />
Rotaciones<br />
(Deudor. - Variac. Prov. Tráfico) / Cifra <strong>de</strong> Negocios (días) 100,31 103,96 102,76 105,97 110<br />
Acreed. C.P. / Consumos Expl. (días) 275,60 266,15 260,31 277,16 299<br />
Indicadores Financieros<br />
Liqui<strong>de</strong>z<br />
Tesorería / Acreed. C.P. (%) 13,69 14,93 14,90 15,38 16,92<br />
[(Deudor.- Variac. Prov. Tráf)+Inver. Finan. Temp.+Teso.] / Acreedor. C.P. (%) 86,66 91,96 91,53 92,48 95,57<br />
Activo Circulante / Acreed. C.P. (%) 141,48 150,78 146,96 149,75 159,87<br />
Solvencia<br />
Gastos Fin./ (Result.Neto Ejer.+ Gastos Fin.)(%) 28,31 23,30 25,62 21,34 21,15<br />
Gast. Fin./ (Rtdo.Antes Impto.+Gastos Fin.)(%) 21,83 17,95 18,84 16,42 16,47<br />
Gast. Fin./ Recursos Generados Totales (%) 22,56 18,42 19,05 16,79 17,85<br />
Recursos Gen. Totales / Exigible Total (%) 11,91 12,61 10,83 11,83 12,63<br />
Activo Total / Exigible Total (%) 168,10 176,92 173,71 169,84 176,12<br />
Rentabilidad y sus componentes<br />
Rentab. Financiera (RF=RE x APF x EF) (%) 9,99 9,95 8,13 10,48 11,04<br />
Resutado Neto Ejerc. / Recursos Propios (%) 9,99 9,95 8,13 10,48 11,04<br />
Rentabilidad E<strong>con</strong>ómica (RE=rem x rer) (%) 7,32 7,32 6,31 7,12 7,77<br />
rem) (Rtdo. Ant Imp+Gast Finan)/Cifra Negocios (%) 9,00 9,53 8,00 9,48 11,85<br />
rer) Cifra <strong>de</strong> Negocios / Activo Total (%) 81,38 76,82 78,84 75,14 65,60<br />
Apalancamiento Fin. (APF=apfgf x apfe) (%) 192,97 188,74 191,26 203,27 193,28<br />
apfgf) Rtdo. Ant Imp/(Rtdo.Ant.Imp+Gast.Finan.) (%) 78,17 82,05 81,16 83,58 83,53<br />
apfe) Activo Total / Recursos Propios (%) 246,85 230,01 235,67 243,19 231,37<br />
Efecto Fiscal (EF) (%) 70,73 72,01 67,39 72,39 73,50<br />
Rtdo. Neto <strong>de</strong>l Ejercicio / Rtdo. Antes Imp. (%) 70,73 72,01 67,39 72,39 73,50<br />
Empleo y costes <strong>de</strong> personal<br />
No. <strong>de</strong> empr. <strong>con</strong> datos en este apartado (nº) 6.920 8.517 10.125 13.542 4.779<br />
No. Medio <strong>de</strong> Trabajadores Fijos por Empr. (nº) 23,19 23,58 22,36 21,33 20,01<br />
No. Medio <strong>de</strong> Trabaj. No Fijos por Empr. (nº) 19,93 17,60 17,20 15,74 14,00<br />
Gasto Medio por Trabajador (euros) 20.673,62 21.932,51 22.398,30 23.687,84 24.582<br />
Valor añadido por Trabajador(euros) 32.265,49 34.551,82 33.665,27 37.552,39 39.407<br />
Gastos <strong>de</strong> Personal / Valor Añadido (%) 64,07 63,48 66,53 63,08 62,38<br />
194<br />
Nota: Los datos <strong>de</strong>l estudio, elaborado <strong>con</strong> la in<strong>forma</strong>ción suministrada por los Registros Mercantiles, están sujetos a los <strong>con</strong>dicionantes indicados en la Metodologia.