Las PYME españolas con forma societaria - Dirección General de ...
Las PYME españolas con forma societaria - Dirección General de ...
Las PYME españolas con forma societaria - Dirección General de ...

Create successful ePaper yourself
Turn your PDF publications into a flip-book with our unique Google optimized e-Paper software.
LAS <strong>PYME</strong> ESPAÑOLAS CON FORMA SOCIETARIA<br />
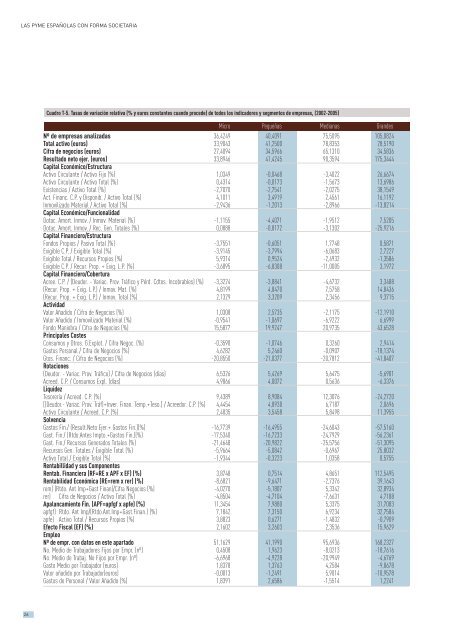
Cuadro T-5. Tasas <strong>de</strong> variación relativa (% y euros <strong>con</strong>stantes cuando proce<strong>de</strong>) <strong>de</strong> todos los indicadores y segmentos <strong>de</strong> empresas, (2002-2005)<br />
Micro Pequeñas Medianas Gran<strong>de</strong>s<br />
Nº <strong>de</strong> empresas analizadas 36,4249 40,4091 75,5095 105,0824<br />
Total activo (euros) 33,9043 41,2500 78,8353 28,5190<br />
Cifra <strong>de</strong> negocios (euros) 27,4094 34,5966 65,1310 34,5836<br />
Resultado neto ejer. (euros) 33,8946 41,4245 90,3594 175,3444<br />
Capital E<strong>con</strong>ómico/Estructura<br />
Activo Circulante / Activo Fijo (%) 1,0349 -0,0468 -3,4022 26,6674<br />
Activo Circulante / Activo Total (%) 0,4314 -0,0173 -1,5673 13,6986<br />
Existencias / Activo Total (%) -2,7070 -2,7541 -2,0275 38,1549<br />
Act. Financ. C.P. y Disponib. / Activo Total (%) 4,1011 3,4919 2,4561 16,1192<br />
Inmovilizado Material / Activo Total (%) -2,9436 -1,2013 -2,8966 -13,8214<br />
Capital E<strong>con</strong>ómico/Funcionalidad<br />
Dotac. Amort. Inmov. / Inmov. Material (%) -1,1155 -4,4071 -1,9512 7,5205<br />
Dotac. Amort. Inmov. / Rec. Gen. Totales (%) 0,0888 -0,8172 -3,1302 -25,9216<br />
Capital Financiero/Estructura<br />
Fondos Propios / Pasivo Total (%) -3,7551 -0,6051 1,7748 0,5871<br />
Exigible C.P. / Exigible Total (%) -3,9145 -3,7994 -6,0683 2,7227<br />
Exigible Total / Recursos Propios (%) 5,9314 0,9524 -2,4932 -1,3586<br />
Exigible C.P. / Recur. Prop. + Exig. L.P. (%) -3,6895 -6,8308 -11,0005 3,1972<br />
Capital Financiero/Cobertura<br />
Acree. C.P. / (Deudor. - Variac. Prov. Tráfico y Pérd. Cdtos. Incobrables) (%) -3,3224 -3,8841 -4,6732 3,3488<br />
(Recur. Prop. + Exig. L.P.) / Inmov. Mat. (%) 4,8199 4,8470 7,5758 14,8436<br />
(Recur. Prop. + Exig. L.P.) / Inmov. Total (%) 2,1329 3,3209 2,3456 9,3715<br />
Actividad<br />
Valor Añadido / Cifra <strong>de</strong> Negocios (%) 1,0308 2,5735 -2,1175 -12,1910<br />
Valor Añadido / Inmovilizado Material (%) -0,9541 -1,0697 -6,9222 6,6999<br />
Fondo Maniobra / Cifra <strong>de</strong> Negocios (%) 15,5877 19,9247 20,9735 43,6528<br />
Principales Costes<br />
Consumos y Otros. G.Explot. / Cifra Negoc. (%) -0,3590 -1,0746 0,3260 2,9414<br />
Gastos Personal / Cifra <strong>de</strong> Negocios (%) 4,6282 5,2460 -0,0907 -18,1374<br />
Gtos. Financ. / Cifra <strong>de</strong> Negocios (%) -20,8550 -21,0377 -20,7812 -41,8407<br />
Rotaciones<br />
(Deudor. - Variac. Prov. Tráfico) / Cifra <strong>de</strong> Negocios (días) 6,5326 5,4269 5,6475 -5,6901<br />
Acreed. C.P. / Consumos Expl. (días) 4,9866 4,0072 0,5636 -6,3376<br />
Liqui<strong>de</strong>z<br />
Tesorería / Acreed. C.P. (%) 9,4389 8,9084 12,3076 -24,2720<br />
[(Deudor.- Variac. Prov. Tráf)+Inver. Finan. Temp.+Teso.] / Acreedor. C.P. (%) 4,4454 4,8930 6,7187 2,0696<br />
Activo Circulante / Acreed. C.P. (%) 2,4835 3,5458 5,8498 11,3955<br />
Solvencia<br />
Gastos Fin./ (Result.Neto Ejer.+ Gastos Fin.)(%) -16,7739 -16,4955 -24,6043 -57,5160<br />
Gast. Fin./ (Rtdo.Antes Impto.+Gastos Fin.)(%) -17,5340 -16,7233 -24,7929 -56,2361<br />
Gast. Fin./ Recursos Generados Totales (%) -21,4648 -20,9822 -25,5756 -51,3095<br />
Recursos Gen. Totales / Exigible Total (%) -5,9664 -5,0842 -0,6967 25,8032<br />
Activo Total / Exigible Total (%) -1,9344 -0,3223 1,0358 0,5755<br />
Rentabillidad y sus Componentes<br />
Rentab. Financiera (RF=RE x APF x EF) (%) 3,8748 0,7514 4,8651 112,5495<br />
Rentabilidad E<strong>con</strong>ómica (RE=rem x rer) (%) -8,6821 -9,6471 -2,7376 39,1643<br />
rem) (Rtdo. Ant Imp+Gast Finan)/Cifra Negocios (%) -4,0270 -5,1807 5,3342 32,8934<br />
rer) Cifra <strong>de</strong> Negocios / Activo Total (%) -4,8504 -4,7104 -7,6631 4,7188<br />
Apalancamiento Fin. (APF=apfgf x apfe) (%) 11,3454 7,9880 5,3375 31,7083<br />
apfgf) Rtdo. Ant Imp/(Rtdo.Ant.Imp+Gast.Finan.) (%) 7,1842 7,3150 6,9234 32,7584<br />
apfe) Activo Total / Recursos Propios (%) 3,8823 0,6271 -1,4832 -0,7909<br />
Efecto Fiscal (EF) (%) 2,1602 3,2603 2,3536 15,9629<br />
Empleo<br />
Nº <strong>de</strong> empr. <strong>con</strong> datos en este apartado 51,1629 41,1990 95,6936 168,2327<br />
No. Medio <strong>de</strong> Trabajadores Fijos por Empr. (nº) 0,4508 1,9623 -8,0213 -18,7616<br />
No. Medio <strong>de</strong> Trabaj. No Fijos por Empr. (nº) -6,6968 -4,9228 -20,9949 -4,6769<br />
Gasto Medio por Trabajador (euros) 1,8378 1,3763 4,2584 -9,8678<br />
Valor añadido por Trabajador(euros) -0,0013 -1,2491 5,9014 -10,9578<br />
Gastos <strong>de</strong> Personal / Valor Añadido (%) 1,8391 2,6586 -1,5514 1,2241<br />
26