Las PYME españolas con forma societaria - Dirección General de ...
Las PYME españolas con forma societaria - Dirección General de ...
Las PYME españolas con forma societaria - Dirección General de ...

You also want an ePaper? Increase the reach of your titles
YUMPU automatically turns print PDFs into web optimized ePapers that Google loves.
LAS <strong>PYME</strong> ESPAÑOLAS CON FORMA SOCIETARIA<br />
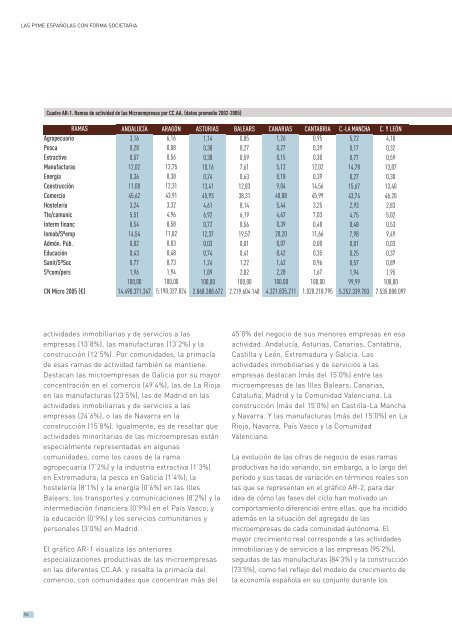
Cuadro AR-1. Ramas <strong>de</strong> actividad <strong>de</strong> las Microempresas por CC.AA. (datos promedio 2002-2005)<br />
RAMAS<br />
Agropecuario<br />
Pesca<br />
Extractivo<br />
Manufacturas<br />
Energía<br />
Construcción<br />
Comercio<br />
Hostelería<br />
Tte/comunic<br />
Interm financ<br />
Inmob/Sºemp<br />
Admón. Púb.<br />
Educación<br />
Sanit/SºSoc<br />
Sºcom/pers<br />
CN Micro 2005 (€)<br />
ANDALUCÍA ARAGÓN ASTURIAS BALEARS CANARIAS CANTABRIA C.-LA MANCHA C. Y LEÓN<br />
3,16<br />
0,28<br />
0,57<br />
12,02<br />
0,36<br />
11,00<br />
45,62<br />
3,24<br />
5,51<br />
0,54<br />
14,54<br />
0,02<br />
0,43<br />
0,77<br />
1,96<br />
100,00<br />
14.490.371.347<br />
6,16<br />
0,08<br />
0,56<br />
12,75<br />
0,38<br />
12,31<br />
43,91<br />
3,32<br />
4,96<br />
0,58<br />
11,82<br />
0,03<br />
0,48<br />
0,73<br />
1,94<br />
100,00<br />
5.190.327.024<br />
1,14<br />
0,30<br />
0,30<br />
10,16<br />
0,24<br />
13,41<br />
45,93<br />
4,61<br />
6,92<br />
0,72<br />
12,37<br />
0,03<br />
0,74<br />
1,24<br />
1,89<br />
100,00<br />
2.868.388.672<br />
0,85<br />
0,27<br />
0,59<br />
7,61<br />
0,63<br />
12,83<br />
38,31<br />
8,14<br />
6,19<br />
0,56<br />
19,57<br />
0,01<br />
0,41<br />
1,22<br />
2,82<br />
100,00<br />
2.219.604.148<br />
1,26<br />
0,27<br />
0,15<br />
5,12<br />
0,18<br />
9,04<br />
48,88<br />
5,44<br />
4,67<br />
0,39<br />
20,20<br />
0,07<br />
0,42<br />
1,62<br />
2,28<br />
100,00<br />
4.321.835.211<br />
0,95<br />
0,39<br />
0,30<br />
12,02<br />
0,39<br />
14,56<br />
45,99<br />
3,25<br />
7,03<br />
0,48<br />
11,66<br />
0,00<br />
0,35<br />
0,96<br />
1,67<br />
100,00<br />
1.020.218.795<br />
5,72<br />
0,17<br />
0,77<br />
14,78<br />
0,27<br />
15,67<br />
43,74<br />
2,93<br />
4,75<br />
0,48<br />
7,98<br />
0,01<br />
0,25<br />
0,57<br />
1,94<br />
99,99<br />
5.252.339.783<br />
4,18<br />
0,32<br />
0,59<br />
13,87<br />
0,30<br />
13,40<br />
46,20<br />
2,83<br />
5,02<br />
0,53<br />
9,49<br />
0,03<br />
0,37<br />
0,89<br />
1,95<br />
100,00<br />
7.535.088.097<br />
activida<strong>de</strong>s inmobiliarias y <strong>de</strong> servicios a las<br />
empresas (13’8%), las manufacturas (13’2%) y la<br />
<strong>con</strong>strucción (12’5%). Por comunida<strong>de</strong>s, la primacía<br />
<strong>de</strong> esas ramas <strong>de</strong> actividad también se mantiene.<br />
Destacan las microempresas <strong>de</strong> Galicia por su mayor<br />
<strong>con</strong>centración en el comercio (49’4%), las <strong>de</strong> La Rioja<br />
en las manufacturas (23’5%), las <strong>de</strong> Madrid en las<br />
activida<strong>de</strong>s inmobiliarias y <strong>de</strong> servicios a las<br />
empresas (24’6%), o las <strong>de</strong> Navarra en la<br />
<strong>con</strong>strucción (15’8%). Igualmente, es <strong>de</strong> resaltar que<br />
activida<strong>de</strong>s minoritarias <strong>de</strong> las microempresas están<br />
especialmente representadas en algunas<br />
comunida<strong>de</strong>s, como los casos <strong>de</strong> la rama<br />
agropecuaria (7’2%) y la industria extractiva (1’3%)<br />
en Extremadura; la pesca en Galicia (1’4%); la<br />
hostelería (8’1%) y la energía (0’6%) en las Illes<br />
Balears; los transportes y comunicaciones (8’2%) y la<br />
intermediación financiera (0’9%) en el País Vasco; y<br />
la educación (0’9%) y los servicios comunitarios y<br />
personales (3’0%) en Madrid.<br />
El gráfico AR-1 visualiza las anteriores<br />
especializaciones productivas <strong>de</strong> las microempresas<br />
en las diferentes CC.AA. y resalta la primacía <strong>de</strong>l<br />
comercio, <strong>con</strong> comunida<strong>de</strong>s que <strong>con</strong>centran más <strong>de</strong>l<br />
45’0% <strong>de</strong>l negocio <strong>de</strong> sus menores empresas en esa<br />
actividad: Andalucía, Asturias, Canarias, Cantabria,<br />
Castilla y León, Extremadura y Galicia. <strong>Las</strong><br />
activida<strong>de</strong>s inmobiliarias y <strong>de</strong> servicios a las<br />
empresas <strong>de</strong>stacan (más <strong>de</strong>l 15’0%) entre las<br />
microempresas <strong>de</strong> las Illes Balears, Canarias,<br />
Cataluña, Madrid y la Comunidad Valenciana. La<br />
<strong>con</strong>strucción (más <strong>de</strong>l 15’0%) en Castilla-La Mancha<br />
y Navarra. Y las manufacturas (más <strong>de</strong>l 15’0%) en La<br />
Rioja, Navarra, País Vasco y la Comunidad<br />
Valenciana.<br />
La evolución <strong>de</strong> las cifras <strong>de</strong> negocio <strong>de</strong> esas ramas<br />
productivas ha ido variando, sin embargo, a lo largo <strong>de</strong>l<br />
período y sus tasas <strong>de</strong> variación en términos reales son<br />
las que se representan en el gráfico AR-2, para dar<br />
i<strong>de</strong>a <strong>de</strong> cómo las fases <strong>de</strong>l ciclo han motivado un<br />
comportamiento diferencial entre ellas, que ha incidido<br />
a<strong>de</strong>más en la situación <strong>de</strong>l agregado <strong>de</strong> las<br />
microempresas <strong>de</strong> cada comunidad autónoma. El<br />
mayor crecimiento real correspon<strong>de</strong> a las activida<strong>de</strong>s<br />
inmobiliarias y <strong>de</strong> servicios a las empresas (95’2%),<br />
seguidas <strong>de</strong> las manufacturas (84’3%) y la <strong>con</strong>strucción<br />
(73’5%), como fiel reflejo <strong>de</strong>l mo<strong>de</strong>lo <strong>de</strong> crecimiento <strong>de</strong><br />
la e<strong>con</strong>omía española en su <strong>con</strong>junto durante los<br />
96