

Climate change
Mercado_Nov2015
Mercado_Nov2015

Create successful ePaper yourself
Turn your PDF publications into a flip-book with our unique Google optimized e-Paper software.
PARAGUAY<br />
tividades estratégicas del<br />
sector seguros. En efecto,<br />
los cinco productos principales<br />
del mercado asegurador<br />
de Paraguay están constituidos<br />
por los seguros de Automóviles,<br />
Vida Colectivo, Incendios,<br />
Riesgos Varios y<br />
Agropecuarios. Juntos conforman<br />
el 78% del total de la<br />
cartera del mercado local en<br />
ese período. Al respecto, cabe<br />
destacar que la diversificación<br />
relativa ha mejorado<br />
respecto al período<br />
2003/2008, en que los cinco<br />
principales productos acumulaban<br />
el 94% del portafolio<br />
del mercado (Ver Gráfico<br />
2).<br />
Evolución Primas de<br />
Reaseguros<br />
Se aprecia una evolución de<br />
las primas cedidas al reaseguro<br />
en el período 2007/2014, notándose<br />
una aceleración de crecimiento<br />
en el período de<br />
análisis con una tasa anual<br />
acumulativa del 32%; con<br />
una trayectoria con bastante<br />
regularidad hasta el año 2010<br />
y adquiriendo, luego, una mayor<br />
dinámica de expansión.<br />
Por su parte, la evolución<br />
del Índice de Primas Cedidas<br />
al Reaseguro se puede apreciar<br />
en el Gráfico 3. Se percibe<br />
una tendencia levemente<br />
decreciente al final del período<br />
en consideración, alcanzando<br />
el más bajo coeficiente<br />
en el año 2007, del orden de<br />
21,0%; mientras que su pico<br />
máximo con 27,3% de incidencia<br />
sobre las primas fue<br />
en el año 2011.<br />
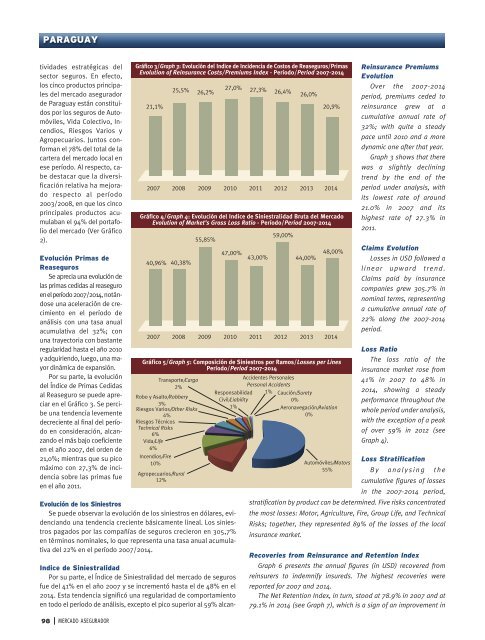
Gráfico 3/Graph 3: Evolución del Indice de Incidencia de Costos de Reaseguros/Primas<br />
Evolution of Reinsurance Costs/Premiums Index - Período/Period 2007-2014<br />
21,1%<br />
Evolución de los Siniestros<br />
Se puede observar la evolución de los siniestros en dólares, evidenciando<br />
una tendencia creciente básicamente lineal. Los siniestros<br />
pagados por las compañías de seguros crecieron en 305,7%<br />
en términos nominales, lo que representa una tasa anual acumulativa<br />
del 22% en el período 2007/2014.<br />
Indice de Siniestralidad<br />
Por su parte, el Índice de Siniestralidad del mercado de seguros<br />
fue del 41% en el año 2007 y se incrementó hasta el de 48% en el<br />
2014. Esta tendencia significó una regularidad de comportamiento<br />
en todo el período de análisis, excepto el pico superior al 59% alcan-<br />
Gráfico 4/Graph 4: Evolución del Indice de Siniestralidad Bruta del Mercado<br />
Evolution of Market’s Gross Loss Ratio - Período/Period 2007-2014<br />
40,96% 40,38%<br />
55,85%<br />
47,00% 43,00%<br />
59,00%<br />
44,00%<br />
48,00%<br />
2007 2008 2009 2010 2011 2012 2013 2014<br />
Gráfico 5/Graph 5: Composición de Siniestros por Ramos/Losses per Lines<br />
Período/Period 2007-2014<br />
Transporte/Cargo<br />
2%<br />
Robo y Asalto/Robbery<br />
3%<br />
Riesgos Varios/Other Risks<br />
4%<br />
Riesgos Técnicos<br />
Technical Risks<br />
6%<br />
Vida/Life<br />
6%<br />
Incendios/Fire<br />
10%<br />
Agropecuarios/Rural<br />
12%<br />
25,5% 26,2%<br />
27,0% 27,3% 26,4% 26,0%<br />
20,9%<br />
2007 2008 2009 2010 2011 2012 2013 2014<br />
Responsabilidad<br />
Civil/Liability<br />
1%<br />
Accidentes Personales<br />
Personal Accidents<br />
1%<br />
Caución/Surety<br />
0%<br />
Aeronavegación/Aviation<br />
0%<br />
Reinsurance Premiums<br />
Evolution<br />
Over the 2007-2014<br />
period, premiums ceded to<br />
reinsurance grew at a<br />
cumulative annual rate of<br />
32%; with quite a steady<br />
pace until 2010 and a more<br />
dynamic one after that year.<br />
Graph 3 shows that there<br />
was a slightly declining<br />
trend by the end of the<br />
period under analysis, with<br />
its lowest rate of around<br />
21.0% in 2007 and its<br />
highest rate of 27.3% in<br />
2011.<br />
Claims Evolution<br />
Losses in USD followed a<br />
l i n e a r u p w a r d t r e n d .<br />
Claims paid by insurance<br />
companies grew 305.7% in<br />
nominal terms, representing<br />
a cumulative annual rate of<br />
22% along the 2007-2014<br />
period.<br />
Loss Ratio<br />
The loss ratio of the<br />
insurance market rose from<br />
41% in 2007 to 48% in<br />
2014, showing a steady<br />
performance throughout the<br />
whole period under analysis,<br />
with the exception of a peak<br />
of over 59% in 2012 (see<br />
Graph 4).<br />
Loss Stratification<br />
Automóviles/Motors<br />
55%<br />
B y a n a l y s i n g t h e<br />
cumulative figures of losses<br />
in the 2007-2014 period,<br />
stratification by product can be determined. Five risks concentrated<br />
the most losses: Motor, Agriculture, Fire, Group Life, and Technical<br />
Risks; together, they represented 89% of the losses of the local<br />
insurance market.<br />
Recoveries from Reinsurance and Retention Index<br />
Graph 6 presents the annual figures (in USD) recovered from<br />
reinsurers to indemnify insureds. The highest recoveries were<br />
reported for 2007 and 2014.<br />
The Net Retention Index, in turn, stood at 78.9% in 2007 and at<br />
79.1% in 2014 (see Graph 7), which is a sign of an improvement in<br />
98<br />
MERCADO ASEGURADOR