

Climate change
Mercado_Nov2015
Mercado_Nov2015

Create successful ePaper yourself
Turn your PDF publications into a flip-book with our unique Google optimized e-Paper software.
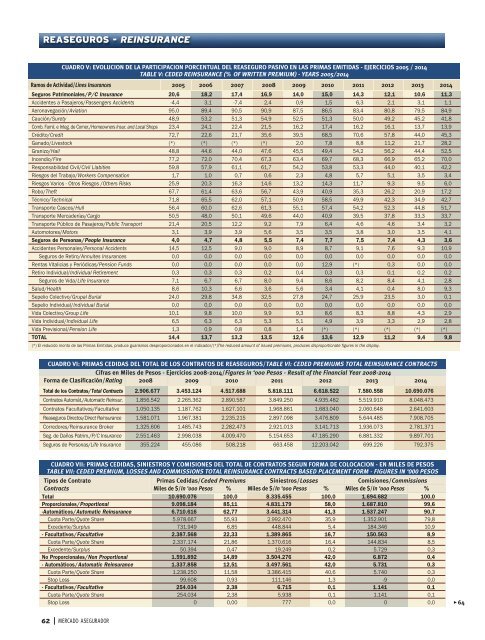
REASEGUROS - REINSURANCE<br />
CUADRO V: EVOLUCION DE LA PARTICIPACION PORCENTUAL DEL REASEGURO PASIVO EN LAS PRIMAS EMITIDAS - EJERCICIOS 2005 / 2014<br />
TABLE V: CEDED REINSURANCE (% OF WRITTEN PREMIUM) - YEARS 2005/2014<br />
Ramos de Actividad/Lines Insurances 2005 2006 2007 2008 2009 2010 2011 2012 2013 2014<br />
Seguros Patrimoniales/P/C Insurance 20,6 18,2 17,4 16,9 14,0 15,0 14,3 12,1 10,6 11,3<br />
Accidentes a Pasajeros/Passengers Accidents -4,4 3,1 -7,4 2,4 0,9 1,5 6,3 2,1 3,1 1,1<br />
Aeronavegación/Aviation 95,0 89,4 90,5 90,9 87,5 86,5 83,4 80,8 79,5 84,9<br />
Caución/Surety 48,9 53,2 51,3 54,9 52,5 51,3 50,0 49,2 45,2 41,8<br />
Comb. Famil. e Integ. de Comer./Homeowners Insur. and Local Shops 23,4 24,1 22,4 21,5 16,2 17,4 16,2 16,1 13,7 13,9<br />
Crédito/Credit 72,7 22,6 21,7 35,6 39,5 68,5 70,6 57,8 44,0 45,3<br />
Ganado/Livestock (*) (*) (*) (*) 2,0 7,8 8,8 11,2 21,7 28,2<br />
Granizo/Hail 48,8 44,6 44,0 47,6 45,5 49,4 54,2 56,2 44,4 52,5<br />
Incendio/Fire 77,2 72,0 70,4 67,3 63,4 69,7 68,3 66,9 65,2 70,0<br />
Responsabilidad Civil/Civil Liabities 59,8 57,9 61,1 61,7 54,2 53,8 53,3 44,0 40,1 42,2<br />
Riesgos del Trabajo/Workers Compensation 1,7 1,0 0,7 0,6 2,3 4,8 5,7 5,1 3,5 3,4<br />
Riesgos Varios - Otros Riesgos /Others Risks 25,9 20,3 16,3 14,6 13,2 14,3 11,7 9,3 9,5 6,0<br />
Robo/Theft 67,7 61,4 63,6 56,7 43,9 40,9 35,3 26,2 20,9 17,2<br />
Técnico/Technical 71,8 65,5 62,0 57,1 50,9 58,5 49,9 42,3 34,9 42,7<br />
Transporte Cascos/Hull 56,4 60,0 62,6 61,3 55,1 57,4 54,2 52,3 44,8 51,7<br />
Transporte Mercaderías/Cargo 50,5 48,0 50,1 49,6 44,0 40,9 39,5 37,8 33,3 33,7<br />
Transporte Público de Pasajeros/Public Transport 21,4 20,5 12,2 9,2 7,9 6,4 4,6 4,6 3,4 3,2<br />
Automotores/Motors 3,1 3,9 3,9 5,6 3,5 3,5 3,8 3,0 3,5 4,1<br />
Seguros de Personas/People Insurance 4,0 4,7 4,8 5,5 7,4 7,7 7,5 7,4 4,3 3,6<br />
Accidentes Personales/Personal Accidents 14,5 12,5 9,0 9,0 8,9 8,7 9,1 7,6 9,3 10,9<br />
Seguros de Retiro/Annuites Insurances 0,0 0,0 0,0 0,0 0,0 0,0 0,0 0,0 0,0 0,0<br />
Rentas Vitalicias y Periódicas/Pension Funds 0,0 0,0 0,0 0,0 0,0 12,9 (*) 0,3 0,0 0,0<br />
Retiro Individual/Individual Retirement 0,3 0,3 0,3 0,2 0,4 0,3 0,3 0,1 0,2 0,2<br />
Seguros de Vida/Life Insurance 7,1 6,7 6,7 8,0 9,4 8,6 8,2 8,4 4,1 2,8<br />
Salud/Health 8,6 10,3 6,6 3,6 5,6 3,4 4,1 0,4 8,0 9,3<br />
Sepelio Colectivo/Grupal Burial 24,0 29,8 34,8 32,5 27,8 24,7 25,9 23,5 3,0 0,1<br />
Sepelio Individual/Individual Burial 0,0 0,0 0,0 0,0 0,0 0,0 0,0 0,0 0,0 0,0<br />
Vida Colectivo/Group Life 10,1 9,8 10,0 9,9 9,3 8,6 8,3 8,8 4,3 2,9<br />
Vida Individual/Individual Life 6,5 6,3 6,3 5,3 5,1 4,9 3,9 3,3 2,9 2,8<br />
Vida Previsional/Pension Life 1,3 0,9 0,8 0,8 1,4 (*) (*) (*) (*) (*)<br />
TOTAL 14,4 13,7 13,2 13,5 12,6 13,6 12,9 11,2 9,4 9,8<br />
(*) El reducido monto de las Primas Emitidas, produce guarismos desproporcionados en el indicador/(*)The reduced amount of issued premiums, produces disproportionate figures in the display.<br />
CUADRO VI: PRIMAS CEDIDAS DEL TOTAL DE LOS CONTRATOS DE REASEGUROS/TABLE VI: CEDED PREMIUMS TOTAL REINSURANCE CONTRACTS<br />
Cifras en Miles de Pesos - Ejercicios 2008-2014/Figures in ‘000 Pesos - Result of the Financial Year 2008-2014<br />
Forma de Clasificación/Rating 2008 2009 2010 2011 2012 2013 2014<br />
Total de los Contratos/Total Contracts 2.906.677 3.453.124 4.517.688 5.818.111 6.618.522 7.580.558 10.690.076<br />
Contratos Automát./Automatic Reinsur. 1.856.542 2.265.362 2.890.587 3.849.250 4.935.482 5.519.910 8.048.473<br />
Contratos Facultativos/Facultative 1.050.135 1.187.762 1.627.101 1.968.861 1.683.040 2.060.648 2.641.603<br />
Reaseguros Directos/Direct Reinsurance 1.581.071 1.967.381 2.235.215 2.897.098 3.476.809 5.644.485 7.908.705<br />
Corredores/Reinsurance Broker 1.325.606 1.485.743 2.282.473 2.921.013 3.141.713 1.936.073 2.781.371<br />
Seg. de Daños Patrim./P/C Insurance 2.551.463 2.998.038 4.009.470 5.154.653 47.185.290 6.881.332 9.897.701<br />
Seguros de Personas/Life Insurance 355.224 455.086 508.218 663.458 12.203.042 699.226 792.375<br />
CUADRO VII: PRIMAS CEDIDAS, SINIESTROS Y COMISIONES DEL TOTAL DE CONTRATOS SEGUN FORMA DE COLOCACION - EN MILES DE PESOS<br />
TABLE VII: CEDED PREMIUM, LOSSES AND COMMISSIONS TOTAL REINSURANCE CONTRACTS BASED PLACEMENT FORM - FIGURES IN ‘000 PESOS<br />
Tipos de Contrato Primas Cedidas/Ceded Premiums Siniestros/Losses Comisiones/Commissions<br />
Contracts Miles de $/In ‘000 Pesos % Miles de $/In ‘000 Pesos % Miles de $/In ‘000 Pesos %<br />
Total 10.690.076 100,0 8.335.455 100,0 1.694.682 100,0<br />
Proporcionales/Proportional 9.098.184 85,11 4.831.179 58,0 1.687.810 99,6<br />
-Automáticos/Automatic Reinsurance 6.710.616 62,77 3.441.314 41,3 1.537.247 90,7<br />
Cuota Parte/Quote Share 5.978.667 55,93 2.992.470 35,9 1.352.901 79,8<br />
Excedente/Surplus 731.949 6,85 448.844 5,4 184.346 10,9<br />
- Facultativos/Facultative 2.387.568 22,33 1.389.865 16,7 150.563 8,9<br />
Cuota Parte/Quote Share 2.337.174 21,86 1.370.616 16,4 144.834 8,5<br />
Excedente/Surplus 50.394 0,47 19.249 0,2 5.729 0,3<br />
No Proporcionales/Non Proportional 1.591.892 14,89 3.504.276 42,0 6.872 0,4<br />
- Automáticos/Automatic Reinsurance 1.337.858 12,51 3.497.561 42,0 5.731 0,3<br />
Cuota Parte/Quote Share 1.238.250 11,58 3.386.415 40,6 5.740 0,3<br />
Stop Loss 99.608 0,93 111.146 1,3 -9 0,0<br />
- Facultativos/Facultative 254.034 2,38 6.715 0,1 1.141 0,1<br />
Cuota Parte/Quote Share 254.034 2,38 5.938 0,1 1.141 0,1<br />
Stop Loss 0 0,00 777 0,0 0 0,0<br />
>64<br />
62<br />
MERCADO ASEGURADOR