

Climate change
Mercado_Nov2015
Mercado_Nov2015

Create successful ePaper yourself
Turn your PDF publications into a flip-book with our unique Google optimized e-Paper software.
URUGUAY<br />
Tabla/Table 2: Evolución de los Ramos en USD - Valores Corrientes de 2008 a 2014/Developement of Lines in USD - Current Values 2008-2014<br />
Ramos/Lines 2008 2009 2010 2011 2012 2013 2014 %^2013<br />
Incendio/Fire 22.648.770 29.816.669 27.866.897 35.718.397 48.307.350 49.784.728 53.732.082 7,9%<br />
Vehículos/Motors 131.522.114 205.011.597 235.282.044 277.172.106 327.935.936 336.119.742 350.200.558 4,2%<br />
Robo/Theft 13.556.016 17.927.827 16.068.074 15.563.055 15.300.593 14.658.800 16.231.328 10,7%<br />
RC/Liability 9.348.079 13.140.436 12.238.095 16.710.739 16.592.310 16.547.096 18.340.542 10,8%<br />
Caución/Surety 4.936.716 8.061.246 8.334.339 10.316.719 12.117.934 13.988.464 14.455.198 3,3%<br />
Transporte/Cargo 20.603.630 23.094.188 25.036.077 31.692.810 35.236.359 32.285.488 34.416.174 6,6%<br />
Otros/Others 20.158.370 30.183.661 28.849.464 36.113.443 37.413.507 33.798.881 46.022.089 36,2%<br />
Rurales/Rural 15.145.249 21.352.458 21.622.204 25.413.436 34.236.422 29.224.248 39.015.921 33,5%<br />
Ingeniería/Engineering 3.110.152 1.857.705 1.890.691 2.581.909 5.487.760 8.167.486 7.427.531 -9,1%<br />
Crédito/Credit 112.541 161.697 152.999 464.897 1.502.554 1.911.616 2.757.719 44,3%<br />
Subtotal Patrimoniales/Subtotal Non-Life 241.141.639 350.607.485 377.340.886 451.747.511 534.130.724 536.486.549 582.599.142 8,6%<br />
Vida/Life 57.726.526 86.726.562 93.853.346 112.931.014 147.848.514 158.514.892 171.281.601 8,1%<br />
Vida Previsional/Pension Life 32.848.551 51.712.473 78.852.377 101.133.753 145.108.575 172.911.741 196.016.815 13,4%<br />
Subtotal Vida/Subtotal Life 90.575.077 138.439.035 172.705.723 214.064.767 292.957.089 331.426.633 367.298.416 10,8%<br />
Accidentes/Accidents 110.994.669 157.337.601 175.247.413 220.341.590 284.376.533 287.267.336 294.706.176 2,6%<br />
Total 442.711.385 646.384.122 725.294.023 886.153.868 1.111.464.346 1.155.180.518 1.244.603.734 7,7%<br />
maduración del sistema previsional.<br />
El mercado de seguros en nuestro país se encuentra altamente<br />
concentrado. Desde el año 1995 el mercado opera en régimen de<br />
competencia, excepto por la rama Accidentes de Trabajo, que continúa<br />
en monopolio a favor del BSE. Considerando el mercado<br />
abierto a la competencia hasta el año 2012, se observa un proceso<br />
de desconcentración. Sin embargo en el año 2013 la concentración<br />
del mercado aumentó, y en el ejercicio 2014 no registró cambios.<br />
La concentración del mercado se explica fundamentalmente por<br />
los seguros de Accidentes de Trabajo, como decíamos, en régimen<br />
de monopolio legal a favor del<br />
BSE, y por los seguros de Vida<br />
Previsional, rama en la que<br />
el sector privado no participa<br />
debido a los problemas de diseño<br />
del sistema y, en especial,<br />
a la falta de calce de moneda<br />
entre los activos y pasivos<br />
que genera ese seguro.<br />
Considerando la participación<br />
en el mercado de cada<br />
compañía, se puede observar<br />
que el BSE concentra el<br />
64,82% del mercado total, lo<br />
que implica una pequeña reducción<br />
de su cuota de mercado<br />
del 0,48% respecto de la<br />
participación al cierre del 2013.<br />
La participación del BSE en<br />
el mercado total se ha mantenido<br />
estable en los últimos<br />
años, en el entorno del 65%.<br />
En cuanto al sector privado,<br />
considerando las empresas<br />
autorizadas a operar por<br />
la Superintendencia de Servicios<br />
Financieros del BCU, la<br />
mayor cuota de mercado corresponde<br />
a MAPFRE, que concentra<br />
el 8,92% del mercado,<br />
experimentando un aumento<br />
de 0,04 puntos porcentuales<br />
respecto del registro correspondiente<br />
al 2013 (8,88 %).<br />
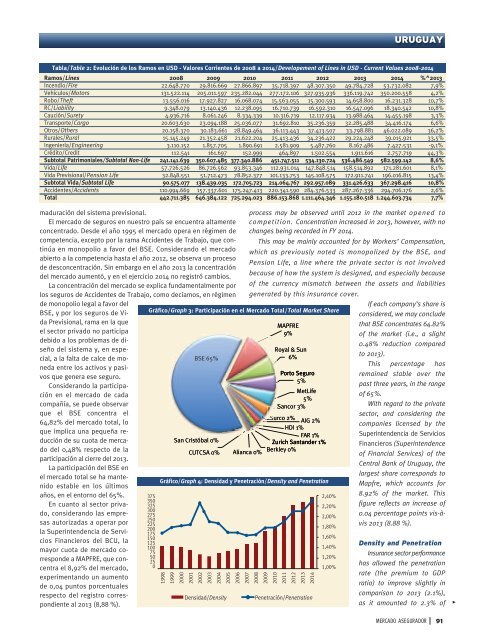
Gráfico/Graph 3: Participación en el Mercado Total/Total Market Share<br />
375<br />
350<br />
325<br />
300<br />
275<br />
250<br />
225<br />
200<br />
175<br />
150<br />
125<br />
100<br />
75<br />
50<br />
25<br />
0<br />
BSE 65%<br />
San Cristóbal 0%<br />
CUTCSA 0% Alianca 0%<br />
Gráfico/Graph 4: Densidad y Penetración/Density and Penetration<br />
1998<br />
1999<br />
2000<br />
2001<br />
2002<br />
2003<br />
2004<br />
2005<br />
2006<br />
2007<br />
2008<br />
2009<br />
2010<br />
2011<br />
2012<br />
2013<br />
2014<br />
Densidad/Density<br />
process may be observed until 2012 in the market opened to<br />
competition. Concentration increased in 2013, however, with no<br />
<strong>change</strong>s being recorded in FY 2014.<br />
This may be mainly accounted for by Workers’ Compensation,<br />
which as previously noted is monopolized by the BSE, and<br />
Pension Life, a line where the private sector is not involved<br />
because of how the system is designed, and especially because<br />
of the currency mismatch between the assets and liabilities<br />
generated by this insurance cover.<br />
If each company’s share is<br />
considered, we may conclude<br />
MAPFRE<br />
9%<br />
that BSE concentrates 64.82%<br />
of the market (i.e., a slight<br />
0.48% reduction compared<br />
Royal & Sun<br />
6%<br />
to 2013).<br />
This percentage has<br />
Porto Seguro<br />
5%<br />
remained stable over the<br />
past three years, in the range<br />
MetLife<br />
of 65%.<br />
5%<br />
Sancor 3%<br />
With regard to the private<br />
sector, and considering the<br />
Surco 2%<br />
AIG 2%<br />
companies licensed by the<br />
HDI 1%<br />
FAR 1%<br />
Superintendencia de Servicios<br />
Zurich Santander 1%<br />
Financieros (Superintendence<br />
Berkley 0%<br />
of Financial Services) of the<br />
Central Bank of Uruguay, the<br />
largest share corresponds to<br />
Mapfre, which accounts for<br />
2,40%<br />
2,20%<br />
2,00%<br />
1,80%<br />
8.92% of the market. This<br />
figure reflects an increase of<br />
0.04 percentage points vis-àvis<br />
2013 (8.88 %).<br />
Penetración/Penetration<br />
1,60%<br />
1,40%<br />
1,20%<br />
1,00%<br />
Density and Penetration<br />
Insurance sector performance<br />
has allowed the penetration<br />
rate (the premium to GDP<br />
ratio) to improve slightly in<br />
comparison to 2013 (2.1%),<br />
as it amounted to 2.3% of<br />
><br />
MERCADO ASEGURADOR<br />
91