

Climate change
Mercado_Nov2015
Mercado_Nov2015

Create successful ePaper yourself
Turn your PDF publications into a flip-book with our unique Google optimized e-Paper software.
ARGENTINA<br />
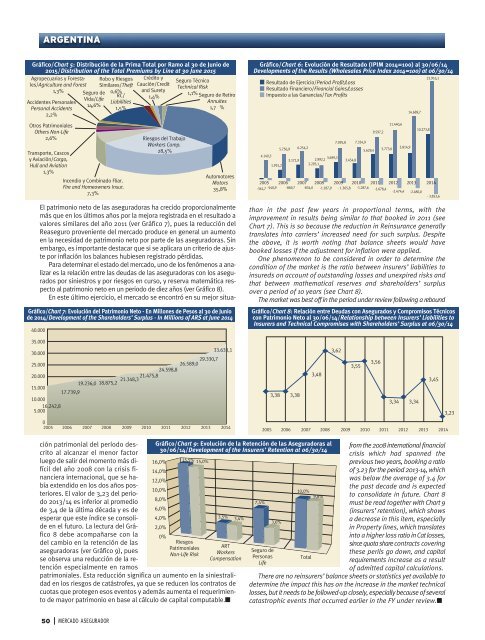
Gráfico/Chart 5: Distribución de la Prima Total por Ramo al 30 de Junio de<br />
2015/Distribution of the Total Premiums by Line at 30 June 2015<br />
Agropecuarios y Forestales/Agriculture<br />
Robo y Riesgos Crédito y<br />
and Forest Similares/Theft Caución/Credit<br />
1,3%<br />
0,6% and Surety<br />
1,4%<br />
Accidentes Personales<br />
Personal Accidents<br />
2,2%<br />
Otros Patrimoniales<br />
Others Non-Life<br />
2,6%<br />
Seguro de<br />
Vida/Life<br />
14,6%<br />
RC/<br />
Liabilities<br />
1,5%<br />
Transporte, Cascos<br />
y Aviación/Cargo,<br />
Hull and Aviation<br />
1,3%<br />
Incendio y Combinado Fliar.<br />
Fire and Homeowners Insur.<br />
7,3%<br />
Riesgos del Trabajo<br />
Workers Comp.<br />
28,5%<br />
Seguro Técnico<br />
Technical Risk<br />
1,1% Seguro de Retiro<br />
Annuites<br />
1,7 %<br />
Automotores<br />
Motors<br />
35,8%<br />
Gráfico/Chart 7: Evolución del Patrimonio Neto - En Millones de Pesos al 30 de Junio<br />
de 2014/Development of the Shareholders’ Surplus - In Millions of AR$ at June 2014<br />
40.000<br />
35.000<br />
33.633,1<br />
30.000<br />
25.000<br />
26.589,0 29.330,7<br />
24.598,8<br />
20.000<br />
19.236,0 18.875,2 21.348,3 21.475,8<br />
15.000<br />
17.739,9<br />
10.000<br />
16.242,8<br />
5.000<br />
0<br />
2005 2006 2007 2008 2009 2010 2011 2012 2013 2014<br />
Gráfico/Chart 6: Evolución de Resultado (IPIM 2014=100) al 30/06/14<br />
Developments of the Results (Wholesales Price Index 2014=100) at 06/30/14<br />
Resultado de Ejercicio/Period Profit/Loss<br />
Resultado Financiero/Financial Gains/Losses<br />
Impuesto a las Ganancias/Tax Profits<br />
7.095,8 7.334,9<br />
5.756,9 6.254,2<br />
5.629,4 5.773,6<br />
5.814,9<br />
4.140,3<br />
3.171,9 2.992,1 3.699,3<br />
1.915,2<br />
2.293,1<br />
2005 2006 2007 2008 2009 2010 2011 2012 2013 2014<br />
-361,7 -540,9 -869,7 -834,0 -1.187,9 - 1.365,8 -1.287,6 -1.678,4<br />
-2.474,4 -2.480,0<br />
- 3.853,6<br />
3.454,8<br />
9.597,2<br />
11.440,6<br />
14.689,7<br />
10.273,8<br />
23.916,1<br />
than in the past few years in proportional terms, with the<br />
improvement in results being similar to that booked in 2011 (see<br />
Chart 7). This is so because the reduction in Reinsurance generally<br />
translates into carriers’ increased need for such surplus. Despite<br />
the above, it is worth noting that balance sheets would have<br />
booked losses if the adjustment for inflation were applied.<br />
One phenomenon to be considered in order to determine the<br />
condition of the market is the ratio between insurers’ liabilities to<br />
insureds on account of outstanding losses and unexpired risks and<br />
that between mathematical reserves and shareholders’ surplus<br />
over a period of 10 years (see Chart 8).<br />
The market was best off in the period under review following a rebound<br />
Gráfico/Chart 8: Relación entre Deudas con Asegurados y Compromisos Técnicos<br />
con Patrimonio Neto al 30/06/14/Relationship between Insurers’ Liabilities to<br />
Insurers and Technical Compromises with Shareholders’ Surplus at 06/30/14<br />
3,38 3,38<br />
3,48<br />
3,62<br />
3,55<br />
3,56<br />
3,34 3,34<br />
3,45<br />
2005 2006 2007 2008 2009 2010 2011 2012 2013 2014<br />
3,23<br />
El patrimonio neto de las aseguradoras ha crecido proporcionalmente<br />
más que en los últimos años por la mejora registrada en el resultado a<br />
valores similares del año 2011 (ver Gráfico 7), pues la reducción del<br />
Reaseguro proveniente del mercado produce en general un aumento<br />
en la necesidad de patrimonio neto por parte de las aseguradoras. Sin<br />
embargo, es importante destacar que si se aplicara un criterio de ajuste<br />
por inflación los balances hubiesen registrado pérdidas.<br />
Para determinar el estado del mercado, uno de los fenómenos a analizar<br />
es la relación entre las deudas de las aseguradoras con los asegurados<br />
por siniestros y por riesgos en curso, y reserva matemática respecto<br />
al patrimonio neto en un periodo de diez años (ver Gráfico 8).<br />
En este último ejercicio, el mercado se encontró en su mejor situación<br />
patrimonial del período descrito<br />
al alcanzar el menor factor<br />
luego de salir del momento más difícil<br />
del año 2008 con la crisis financiera<br />
internacional, que se había<br />
extendido en los dos años posteriores.<br />
El valor de 3,23 del periodo<br />
2013/14 es inferior al promedio<br />
de 3,4 de la última década y es de<br />
esperar que este índice se consolide<br />
en el futuro. La lectura del Gráfico<br />
8 debe acompañarse con la<br />
del cambio en la retención de las<br />
aseguradoras (ver Gráfico 9), pues<br />
se observa una reducción de la retención<br />
especialmente en ramos<br />
patrimoniales. Esta reducción significa un aumento en la siniestralidad<br />
en los riesgos de catástrofes, ya que se reducen los contratos de<br />
cuotas que protegen esos eventos y además aumenta el requerimiento<br />
de mayor patrimonio en base al cálculo de capital computable.■<br />
Gráfico/Chart 9: Evolución de la Retención de las Aseguradoras al<br />
30/06/14/Development of the Insurers’ Retention at 06/30/14<br />
16,0% 15,5% 15,0%<br />
14,0%<br />
12,0%<br />
10,0%<br />
10,0%<br />
9,8%<br />
8,0%<br />
7,4%<br />
6,0%<br />
4,0%<br />
3,5% 3,4%<br />
3,6%<br />
2,0%<br />
0%<br />
Riesgos<br />
Patrimoniales<br />
Non-Life Risk<br />
ART<br />
Workers<br />
Compensation<br />
Seguro de<br />
Personas<br />
Life<br />
Total<br />
from the 2008 international financial<br />
crisis which had spanned the<br />
previous two years, booking a ratio<br />
of 3.23 for the period 2013-14, which<br />
was below the average of 3.4 for<br />
the past decade and is expected<br />
to consolidate in future. Chart 8<br />
must be read together with Chart 9<br />
(insurers’ retention), which shows<br />
a decrease in this item, especially<br />
in Property lines, which translates<br />
into a higher loss ratio in Cat losses,<br />
since quota share contracts covering<br />
these perils go down, and capital<br />
requirements increase as a result<br />
of admitted capital calculations.<br />
There are no reinsurers’ balance sheets or statistics yet available to<br />
determine the impact this has on the increase in the market technical<br />
losses, but it needs to be followed-up closely, especially because of several<br />
catastrophic events that occurred earlier in the FY under review.■<br />
50<br />
MERCADO ASEGURADOR