

Climate change
Mercado_Nov2015
Mercado_Nov2015

You also want an ePaper? Increase the reach of your titles
YUMPU automatically turns print PDFs into web optimized ePapers that Google loves.
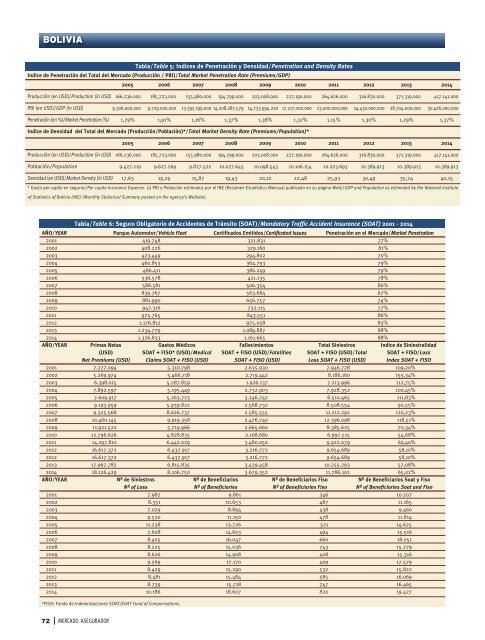
BOLIVIA<br />
Tabla/Table 5: Indices de Penetración y Densidad/Penetration and Density Rates<br />
Indice de Penetración del Total del Mercado (Producción / PBI)/Total Market Penetration Rate (Premiums/GDP)<br />
2005 2006 2007 2008 2009 2010 2011 2012 2013 2014<br />
Producción (en USD)/Production (in USD) 166.236.000 185.723.000 155.980.000 194.799.000 203.008.000 227.190.000 264.626.000 316.830.000 371.319.000 417.141.000<br />
PBI (en USD)/GDP (in USD) 9.306.000.000 9.729.000.000 13.395.199.000 14.208.287.579 14.733.994.220 17.217.000.000 23.000.000.000 24.430.000.000 28.704.000.000 30.426.000.000<br />
Penetración (en %)/Market Penetration (%) 1,79% 1,91% 1,16% 1,37% 1,38% 1,32% 1,15% 1,30% 1,29% 1,37%<br />
Indice de Densidad del Total del Mercado (Producción/Población)*/Total Market Density Rate (Premiums/Population)*<br />
2005 2006 2007 2008 2009 2010 2011 2012 2013 2014<br />
Producción (en USD)/Production (in USD) 166.236.000 185.723.000 155.980.000 194.799.000 203.008.000 227.190.000 264.626.000 316.830.000 371.319.000 417.141.000<br />
Población/Population 9.427.219 9.627.269 9.827.522 10.027.643 10.098.543 10.106.154 10.203.693 10.389.913 10.389.913 10.389.913<br />
Densidad (en USD)/Market Density (in USD) 17,63 19,29 15,87 19,43 20,10 22,48 25,93 30,49 35,74 40,15<br />
* Gasto per capita en seguros/Per capita Insurance Expense. (1) PBI y Población estimados por el INE (Resúmen Estadístico Mensual publicado en su página Web)/GDP and Population as estimated by the National Institute<br />
of Statistics of Bolivia (INE) (Monthly Statistical Summary posted on the agency’s Website).<br />
Tabla/Table 6: Seguro Obligatorio de Accidentes de Tránsito (SOAT)/Mandatory Traffic Accident Insurance (SOAT) 2001 - 2014<br />
AÑO/YEAR Parque Automotor/Vehicle Fleet Certificados Emitidos/Certificated Issues Penetración en el Mercado/Market Penetration<br />
2001 419.748 321.831 77%<br />
2002 408.226 329.160 81%<br />
2003 423.449 294.802 70%<br />
2004 460.853 364.793 79%<br />
2005 486.411 386.249 79%<br />
2006 536.578 421.135 78%<br />
2007 588.581 506.354 86%<br />
2008 839.767 563.684 67%<br />
2009 881.990 656.757 74%<br />
2010 947.316 732.115 77%<br />
2011 975.765 843.551 86%<br />
2012 1.176.812 975.058 83%<br />
2013 1.234.779 1.089.887 88%<br />
2014 1.326.833 1.161.665 88%<br />
AÑO/YEAR Primas Netas Gastos Médicos Fallecimientos Total Siniestros Indice de Siniestralidad<br />
(USD) SOAT + FISO* (USD)/Medical SOAT + FISO (USD)/Fatalities SOAT + FISO (USD)/Total SOAT + FISO/Loss<br />
Net Premiums (USD) Claims SOAT + FISO (USD) SOAT + FISO (USD) Loss SOAT + FISO (USD) Index SOAT + FISO<br />
2001 7.277.094 5.310.798 2.635.930 7.946.728 109,20%<br />
2002 5.269.974 5.466.718 2.719.442 8.186.160 155,34%<br />
2003 6.398.015 5.287.859 1.926.137 7.213.996 112,75%<br />
2004 7.892.597 5.195.449 2.732.903 7.928.352 100,45%<br />
2005 7.609.917 5.263.723 3.246.742 8.510.465 111,83%<br />
2006 9.193.959 5.939.822 2.568.732 8.508.554 92,55%<br />
2007 9.325.568 8.626.737 2.585.555 11.212.292 120,23%<br />
2008 10.460.145 9.919.358 2.476.740 12.396.098 118,51%<br />
2009 11.921.522 5.719.966 2.665.660 8.385.625 70,34%<br />
2010 12.796.626 4.828.835 2.168.680 6.997.515 54,68%<br />
2011 14.297.810 6.442.029 3.480.050 9.922.079 69,40%<br />
2012 16.617.372 6.437.917 3.216.772 9.654.689 58,10%<br />
2012 16.617.372 6.437.917 3.216.772 9.654.689 58,10%<br />
2013 17.967.782 6.815.835 3.439.458 10.255.293 57,08%<br />
2014 18.126.429 8.106.750 3.679.352 11.786.102 65,02%<br />
AÑO/YEAR Nº de Siniestros Nº de Beneficiarios Nº de Beneficiarios Fiso Nº de Beneficiarios Soat y Fiso<br />
Nº of Loss Nº of Beneficiaries Nº of Beneficiaries Fiso Nº of Beneficiaries Soat and Fiso<br />
2001 7.982 9.861 346 10.207<br />
2002 8.351 10.653 487 11.165<br />
2003 7.029 8.894 438 9.460<br />
2004 9.520 11.150 478 11.814<br />
2005 11.238 13.726 521 14.625<br />
2006 7.608 14.603 494 15.516<br />
2007 8.405 16.047 660 18.051<br />
2008 8.225 15.036 743 15.779<br />
2009 8.626 14.908 408 15.316<br />
2010 9.569 17.170 409 17.579<br />
2011 8.429 15.290 532 15.822<br />
2012 8.481 15.484 585 16.069<br />
2013 8.739 15.718 747 16.465<br />
2014 10.186 18.607 820 19.427<br />
*FISO: Fondo de Indemnizaciones SOAT/SOAT Fund of Compensations.<br />
72<br />
MERCADO ASEGURADOR