

Climate change
Mercado_Nov2015
Mercado_Nov2015

You also want an ePaper? Increase the reach of your titles
YUMPU automatically turns print PDFs into web optimized ePapers that Google loves.
PARAGUAY<br />
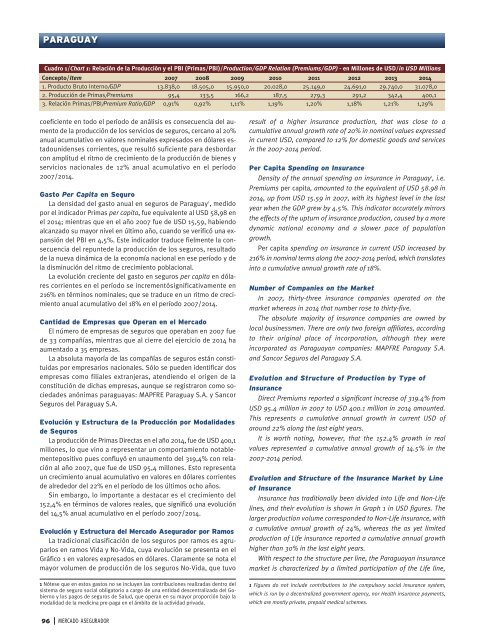
Cuadro 1/Chart 1: Relación de la Producción y el PBI (Primas/PBI)/Production/GDP Relation (Premiums/GDP) - en Millones de USD/in USD Millions<br />
Concepto/Item 2007 2008 2009 2010 2011 2012 2013 2014<br />
1. Producto Bruto Interno/GDP 13.838,0 18.505,0 15.950,0 20.028,0 25.149,0 24.691,0 29.740,0 31.078,0<br />
2. Producción de Primas/Premiums 95,4 133,5 166,2 187,5 279,3 291,2 342,4 400,1<br />
3. Relación Primas/PBI/Premium Ratio/GDP 0,91% 0,92% 1,11% 1,19% 1,20% 1,18% 1,21% 1,29%<br />
coeficiente en todo el período de análisis es consecuencia del aumento<br />
de la producción de los servicios de seguros, cercano al 20%<br />
anual acumulativo en valores nominales expresados en dólares estadounidenses<br />
corrientes, que resultó suficiente para desbordar<br />
con amplitud el ritmo de crecimiento de la producción de bienes y<br />
servicios nacionales de 12% anual acumulativo en el período<br />
2007/2014.<br />
Gasto Per Capita en Seguro<br />
La densidad del gasto anual en seguros de Paraguay 1 , medido<br />
por el indicador Primas per capita, fue equivalente al USD 58,98 en<br />
el 2014; mientras que en el año 2007 fue de USD 15,59, habiendo<br />
alcanzado su mayor nivel en último año, cuando se verificó una expansión<br />
del PBI en 4,5%. Este indicador traduce fielmente la consecuencia<br />
del repuntede la producción de los seguros, resultado<br />
de la nueva dinámica de la economía nacional en ese período y de<br />
la disminución del ritmo de crecimiento poblacional.<br />
La evolución creciente del gasto en seguros per capita en dólares<br />
corrientes en el período se incrementósignificativamente en<br />
216% en términos nominales; que se traduce en un ritmo de crecimiento<br />
anual acumulativo del 18% en el período 2007/2014.<br />
Cantidad de Empresas que Operan en el Mercado<br />
El número de empresas de seguros que operaban en 2007 fue<br />
de 33 compañías, mientras que al cierre del ejercicio de 2014 ha<br />
aumentado a 35 empresas.<br />
La absoluta mayoría de las compañías de seguros están constituidas<br />
por empresarios nacionales. Sólo se pueden identificar dos<br />
empresas como filiales extranjeras, atendiendo el origen de la<br />
constitución de dichas empresas, aunque se registraron como sociedades<br />
anónimas paraguayas: MAPFRE Paraguay S.A. y Sancor<br />
Seguros del Paraguay S.A.<br />
Evolución y Estructura de la Producción por Modalidades<br />
de Seguros<br />
La producción de Primas Directas en el año 2014, fue de USD 400,1<br />
millones, lo que vino a representar un comportamiento notablementepositivo<br />
pues confluyó en unaumento del 319,4% con relación<br />
al año 2007, que fue de USD 95,4 millones. Esto representa<br />
un crecimiento anual acumulativo en valores en dólares corrientes<br />
de alrededor del 22% en el período de los últimos ocho años.<br />
Sin embargo, lo importante a destacar es el crecimiento del<br />
152,4% en términos de valores reales, que significó una evolución<br />
del 14,5% anual acumulativo en el período 2007/2014.<br />
Evolución y Estructura del Mercado Asegurador por Ramos<br />
La tradicional clasificación de los seguros por ramos es agruparlos<br />
en ramos Vida y No-Vida, cuya evolución se presenta en el<br />
Gráfico 1 en valores expresados en dólares. Claramente se nota el<br />
mayor volumen de producción de los seguros No-Vida, que tuvo<br />
1 Nótese que en estos gastos no se incluyen las contribuciones realizadas dentro del<br />
sistema de seguro social obligatorio a cargo de una entidad descentralizada del Gobierno<br />
y los pagos de seguros de Salud, que operan en su mayor proporción bajo la<br />
modalidad de la medicina pre-paga en el ámbito de la actividad privada.<br />
result of a higher insurance production, that was close to a<br />
cumulative annual growth rate of 20% in nominal values expressed<br />
in current USD, compared to 12% for domestic goods and services<br />
in the 2007-2014 period.<br />
Per Capita Spending on Insurance<br />
Density of the annual spending on insurance in Paraguay 1 , i.e.<br />
Premiums per capita, amounted to the equivalent of USD 58.98 in<br />
2014, up from USD 15.59 in 2007, with its highest level in the last<br />
year when the GDP grew by 4.5%. This indicator accurately mirrors<br />
the effects of the upturn of insurance production, caused by a more<br />
dynamic national economy and a slower pace of population<br />
growth.<br />
Per capita spending on insurance in current USD increased by<br />
216% in nominal terms along the 2007-2014 period, which translates<br />
into a cumulative annual growth rate of 18%.<br />
Number of Companies on the Market<br />
In 2007, thirty-three insurance companies operated on the<br />
market whereas in 2014 that number rose to thirty-five.<br />
The absolute majority of insurance companies are owned by<br />
local businessmen. There are only two foreign affiliates, according<br />
to their original place of incorporation, although they were<br />
incorporated as Paraguayan companies: MAPFRE Paraguay S.A.<br />
and Sancor Seguros del Paraguay S.A.<br />
Evolution and Structure of Production by Type of<br />
Insurance<br />
Direct Premiums reported a significant increase of 319.4% from<br />
USD 95.4 million in 2007 to USD 400.1 million in 2014 amounted.<br />
This represents a cumulative annual growth in current USD of<br />
around 22% along the last eight years.<br />
It is worth noting, however, that the 152.4% growth in real<br />
values represented a cumulative annual growth of 14.5% in the<br />
2007-2014 period.<br />
Evolution and Structure of the Insurance Market by Line<br />
of Insurance<br />
Insurance has traditionally been divided into Life and Non-Life<br />
lines, and their evolution is shown in Graph 1 in USD figures. The<br />
larger production volume corresponded to Non-Life insurance, with<br />
a cumulative annual growth of 24%, whereas the as yet limited<br />
production of Life insurance reported a cumulative annual growth<br />
higher than 30% in the last eight years.<br />
With respect to the structure per line, the Paraguayan insurance<br />
market is characterized by a limited participation of the Life line,<br />
1 Figures do not include contributions to the compulsory social insurance system,<br />
which is run by a decentralized government agency, nor Health insurance payments,<br />
which are mostly private, prepaid medical schemes.<br />
96<br />
MERCADO ASEGURADOR