

Climate change
Mercado_Nov2015
Mercado_Nov2015

You also want an ePaper? Increase the reach of your titles
YUMPU automatically turns print PDFs into web optimized ePapers that Google loves.
PERU<br />
Panorama del Mercado Asegurador Peruano<br />
Overview of the Peruvian Insurance Market<br />
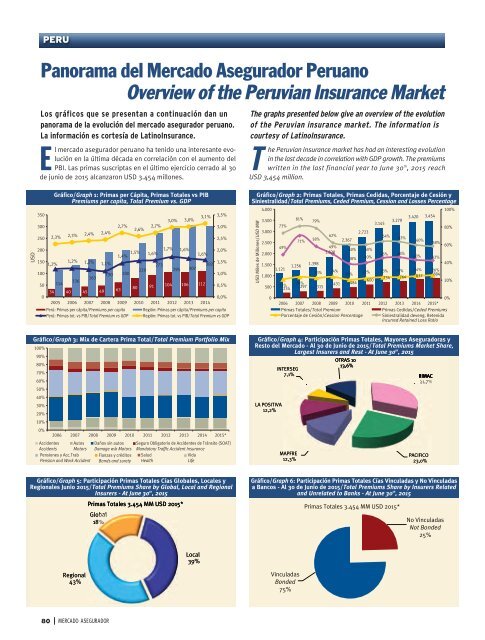
Los gráficos que se presentan a continuación dan un<br />
panorama de la evolución del mercado asegurador peruano.<br />
La información es cortesía de LatinoInsurance.<br />
El mercado asegurador peruano ha tenido una interesante evolución<br />
en la última década en correlación con el aumento del<br />
PBI. Las primas suscriptas en el último ejercicio cerrado al 30<br />
de junio de 2015 alcanzaron USD 3.454 millones.<br />
The graphs presented below give an overview of the evolution<br />
of the Peruvian insurance market. The information is<br />
courtesy of LatinoInsurance.<br />
T<br />
he<br />
USD 3,454 million.<br />
Peruvian insurance market has had an interesting evolution<br />
in the last decade in correlation with GDP growth. The premiums<br />
written in the last financial year to June 30 th , 2015 reach<br />
USD<br />
350<br />
300<br />
250<br />
200<br />
150<br />
1,2%<br />
100<br />
50<br />
0<br />
Gráfico/Graph 1: Primas per Cápita, Primas Totales vs PIB<br />
Premiums per capita, Total Premium vs. GDP<br />
2,3% 2,3% 2,4% 2,4%<br />
114<br />
1,2% 1,2% 1,1%<br />
136<br />
163<br />
190 200<br />
34 40 45 49 63<br />
2,7%<br />
2,6%<br />
1,4% 1,5% 1,6%<br />
229<br />
2,7%<br />
273<br />
3,0% 3,0%<br />
1,7% 1,6%<br />
295 307<br />
1,6%<br />
80 91 104 106 112<br />
3,1%<br />
2005 2006 2007 2008 2009 2010 2011 2012 2013 2014<br />
Perú: Primas per cápita/Premiums per capita<br />
Perú: Primas tot. vs PIB/Total Premium vs GDP<br />
302<br />
3,5%<br />
3,0%<br />
2,5%<br />
2,0%<br />
1,5%<br />
1,0%<br />
0,5%<br />
0,0%<br />
Región: Primas per cápita/Premiums per capita<br />
Región: Primas tot. vs PIB/Total Premium vs GDP<br />
Gráfico/Graph 2: Primas Totales, Primas Cedidas, Porcentaje de Cesión y<br />
Siniestralidad/Total Premiums, Ceded Premium, Cession and Losses Percentage<br />
USD Miles de Millones/USD MM<br />
4.000<br />
3.500<br />
3.000<br />
2.500<br />
2.000<br />
73%<br />
49%<br />
1.500<br />
1.121<br />
1.000<br />
500<br />
0<br />
21%<br />
234<br />
81%<br />
1.256<br />
71%<br />
79%<br />
58%<br />
1.398<br />
24%<br />
297 315<br />
62%<br />
49%<br />
1.820<br />
23% 24%<br />
431<br />
2.367<br />
2.723<br />
60% 60%<br />
38% 40%<br />
3.145<br />
3.279<br />
64% 63%<br />
45% 46%<br />
3.420 3.454<br />
60%<br />
58%<br />
43% 42%<br />
0%<br />
2006 2007 2008 2009 2010 2011 2012 2013 2014 2015*<br />
Primas Totales/Total Premium<br />
Primas Cedidas/Ceded Premiums<br />
Porcentaje de Cesión/Cession Percentage Siniestralidad deveng. Retenida<br />
Incurred Retained Loss Ratio<br />
100%<br />
80%<br />
60%<br />
40%<br />
20%<br />
22% 23% 23% 24% 26%<br />
734 764 837 884<br />
600<br />
484<br />
20%<br />
Gráfico/Graph 3: Mix de Cartera Prima Total/Total Premium Portfolio Mix<br />
100%<br />
90%<br />
80%<br />
70%<br />
60%<br />
50%<br />
40%<br />
30%<br />
20%<br />
10%<br />
0%<br />
2006 2007 2008 2009 2010 2011 2012 2013 2014 2015*<br />
Accidentes Autos Daños sin autos Seguro Obligatorio de Accidentes de Tránsito (SOAT)<br />
Accidents Motors Damage w/o Motors Mandatory Traffic Accident Insurance<br />
Pensiones y Acc.Trab Fianzas y créditos Salud<br />
Vida<br />
Pension and Work Accident Bonds and surety Health<br />
Life<br />
Gráfico/Graph 4: Participación Primas Totales, Mayores Aseguradoras y<br />
Resto del Mercado - Al 30 de Junio de 2015/Total Premiums Market Share,<br />
Largest Insurers 3.454 and MM Rest USD - At 2015* June 30 th , 2015<br />
OTRAS 10<br />
13,6%<br />
INTERSEG<br />
7,1%<br />
RIMAC<br />
31,7%<br />
LA POSITIVA<br />
12,2%<br />
MAPFRE<br />
PACIFICO<br />
12,3%<br />
23,0%<br />
Gráfico/Graph 5: Participación Primas Totales Cías Globales, Locales y<br />
Regionales Junio 2015/Total Premiums Share by Global, Local and Regional<br />
Insurers - At June 30 th , 2015<br />
Primas Totales 3.454 MM USD 2015*<br />
Global<br />
18%<br />
Gráfico/Graph 6: Participación Primas Totales Cías Vinculadas y No Vinculadas<br />
a Bancos - Al 30 de Junio de 2015/Total Premiums Share by Insurers Related<br />
and Unrelated to Banks - At June 30 th , 2015<br />
Primas Totales 3.454 MM USD 2015*<br />
No Vinculadas<br />
Not Bonded<br />
25%<br />
Local<br />
39%<br />
Regional<br />
43%<br />
Vinculadas<br />
Bonded<br />
75%<br />
80<br />
MERCADO ASEGURADOR