

Climate change
Mercado_Nov2015
Mercado_Nov2015

Create successful ePaper yourself
Turn your PDF publications into a flip-book with our unique Google optimized e-Paper software.
PARAGUAY<br />
zado en el año 2012, conforme<br />
se puede observar en el<br />
Gráfico 4.<br />
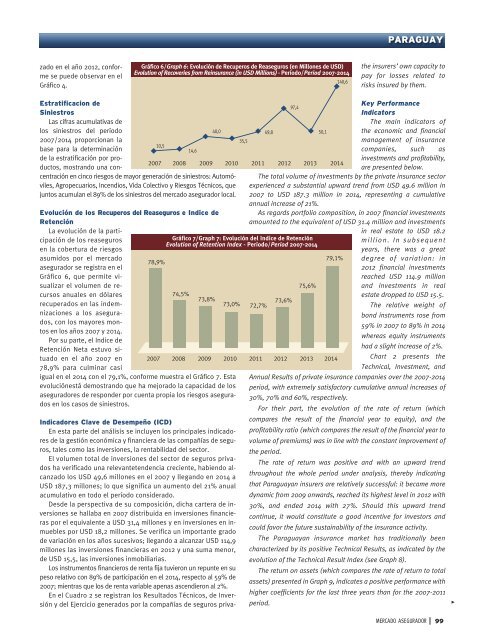
Gráfico 6/Graph 6: Evolución de Recuperos de Reaseguros (en Millones de USD)<br />
Evolution of Recoveries from Reinsurance (in USD Millions) - Período/Period 2007-2014<br />
140,6<br />
Indicadores Clave de Desempeño (ICD)<br />
En esta parte del análisis se incluyen los principales indicadores<br />
de la gestión económica y financiera de las compañías de seguros,<br />
tales como las inversiones, la rentabilidad del sector.<br />
El volumen total de inversiones del sector de seguros privados<br />
ha verificado una relevantetendencia creciente, habiendo alcanzado<br />
los USD 49,6 millones en el 2007 y llegando en 2014 a<br />
USD 187,3 millones; lo que significa un aumento del 21% anual<br />
acumulativo en todo el período considerado.<br />
Desde la perspectiva de su composición, dicha cartera de inversiones<br />
se hallaba en 2007 distribuida en inversiones financieras<br />
por el equivalente a USD 31,4 millones y en inversiones en inmuebles<br />
por USD 18,2 millones. Se verifica un importante grado<br />
de variación en los años sucesivos; llegando a alcanzar USD 114,9<br />
millones las inversiones financieras en 2012 y una suma menor,<br />
de USD 15,5, las inversiones inmobiliarias.<br />
Los instrumentos financieros de renta fija tuvieron un repunte en su<br />
peso relativo con 89% de participación en el 2014, respecto al 59% de<br />
2007; mientras que los de renta variable apenas ascendieron al 2%.<br />
En el Cuadro 2 se registran los Resultados Técnicos, de Inversión<br />
y del Ejercicio generados por la compañías de seguros privathe<br />
insurers’ own capacity to<br />
pay for losses related to<br />
risks insured by them.<br />
Estratificacion de<br />
Siniestros<br />
Las cifras acumulativas de<br />
los siniestros del período<br />
40,0<br />
2007/2014 proporcionan la<br />
base para la determinación<br />
de la estratificación por productos,<br />
mostrando una concentración<br />
10,5<br />
14,6<br />
en cinco riesgos de mayor generación de siniestros: Automó-<br />
viles, Agropecuarios, Incendios, Vida Colectivo y Riesgos Técnicos, que<br />
juntos acumulan el 89% de los siniestros del mercado asegurador local.<br />
Evolución de los Recuperos del Reaseguros e Indice de<br />
Retención<br />
La evolución de la participación<br />
de los reaseguros<br />
en la cobertura de riesgos<br />
asumidos por el mercado<br />
asegurador se registra en el<br />
Gráfico 6, que permite visualizar<br />
el volumen de recursos<br />
anuales en dólares<br />
recuperados en las indemnizaciones<br />
a los asegurados,<br />
con los mayores montos<br />
en los años 2007 y 2014.<br />
Por su parte, el Indice de<br />
Retención Neta estuvo situado<br />
en el año 2007 en<br />
78,9% para culminar casi<br />
78,9%<br />
igual en el 2014 con el 79,1%, conforme muestra el Gráfico 7. Esta<br />
evoluciónestá demostrando que ha mejorado la capacidad de los<br />
aseguradores de responder por cuenta propia los riesgos asegurados<br />
en los casos de siniestros.<br />
35,5<br />
2007 2008 2009 2010 2011 2012 2013 2014<br />
Gráfico 7/Graph 7: Evolución del Indice de Retención<br />
Evolution of Retention Index - Período/Period 2007-2014<br />
74,5%<br />
73,8%<br />
73,0% 72,7% 73,6% 75,6%<br />
2007 2008 2009 2010 2011 2012 2013 2014<br />
97,4<br />
Key Performance<br />
Indicators<br />
49,8<br />
50,1<br />
The main indicators of<br />
the economic and financial<br />
management of insurance<br />
companies, such as<br />
investments and profitability,<br />
are presented below.<br />
The total volume of investments by the private insurance sector<br />
experienced a substantial upward trend from USD 49.6 million in<br />
2007 to USD 187.3 million in 2014, representing a cumulative<br />
annual increase of 21%.<br />
As regards portfolio composition, in 2007 financial investments<br />
amounted to the equivalent of USD 31.4 million and investments<br />
79,1%<br />
in real estate to USD 18.2<br />
m i l l i o n . I n s u b s e q u e n t<br />
years, there was a great<br />
degree of variation: in<br />
2012 financial investments<br />
reached USD 114.9 million<br />
and investments in real<br />
estate dropped to USD 15.5.<br />
The relative weight of<br />
bond instruments rose from<br />
59% in 2007 to 89% in 2014<br />
whereas equity instruments<br />
had a slight increase of 2%.<br />
Chart 2 presents the<br />
Technical, Investment, and<br />
Annual Results of private insurance companies over the 2007-2014<br />
period, with extremely satisfactory cumulative annual increases of<br />
30%, 70% and 60%, respectively.<br />
For their part, the evolution of the rate of return (which<br />
compares the result of the financial year to equity), and the<br />
profitability ratio (which compares the result of the financial year to<br />
volume of premiums) was in line with the constant improvement of<br />
the period.<br />
The rate of return was positive and with an upward trend<br />
throughout the whole period under analysis, thereby indicating<br />
that Paraguayan insurers are relatively successful: it became more<br />
dynamic from 2009 onwards, reached its highest level in 2012 with<br />
30%, and ended 2014 with 27%. Should this upward trend<br />
continue, it would constitute a good incentive for investors and<br />
could favor the future sustainability of the insurance activity.<br />
The Paraguayan insurance market has traditionally been<br />
characterized by its positive Technical Results, as indicated by the<br />
evolution of the Technical Result Index (see Graph 8).<br />
The return on assets (which compares the rate of return to total<br />
assets) presented in Graph 9, indicates a positive performance with<br />
higher coefficients for the last three years than for the 2007-2011<br />
period.<br />
><br />
MERCADO ASEGURADOR<br />
99