- Page 2 and 3:
Prestação de Contas 2007 - Univer
- Page 4 and 5:
REITORIA Reitor: Eden Januário Net
- Page 6 and 7:
Representantes do Campus Francisco
- Page 8 and 9:
4.17 Acompanhamento das certificaç
- Page 10 and 11:
8.1 - Demonstrativo da Execução O
- Page 12 and 13:
Prestação de Contas 2007 - Univer
- Page 14 and 15:
Prestação de Contas 2007 - Univer
- Page 16 and 17: Prestação de Contas 2007 - Univer
- Page 18 and 19: do Regulamento do Trabalho de Concl
- Page 20 and 21: com a realização de concurso púb
- Page 22 and 23: OBJETIVOS Gestão Sistêmica: Desce
- Page 24 and 25: Fortalecimento da Marca da UTFPR: E
- Page 26 and 27: CAMPUS CAMPO MOURÃO - CM CNPJ: 75.
- Page 28 and 29: ORGANOGRAMA Prestação de Contas 2
- Page 30 and 31: Sigla Descrição FB Francisco Belt
- Page 32 and 33: (10) Ensino a Distância. (11) Prog
- Page 34 and 35: 1.4 Comissão de Implantação da E
- Page 36 and 37: 1.8 Comissão das Bibliotecas Quadr
- Page 38 and 39: Portaria nº385, de 13/04/07 - Reit
- Page 40 and 41: Em 2007, o MEC divulgou os resultad
- Page 42 and 43: • Participação na ExpoUT 2007 -
- Page 44 and 45: • Regulamento dos Estágios dos C
- Page 46 and 47: Cursos Campus AP CM CP CT DV FB LD
- Page 48 and 49: Cursos Campus AP CM CP CT DV FB LD
- Page 50 and 51: Cursos Cursos AP CM CP CT DV FB LD
- Page 52 and 53: Cursos Cursos AP CM CP CT DV FB LD
- Page 54 and 55: Participação de cada Campus nas m
- Page 56 and 57: O gráfico da figura 5 apresenta a
- Page 58 and 59: Cursos Campus CM CP CT DV MD PB PG
- Page 60 and 61: Campus CURSOS CP Produção Mecâni
- Page 62 and 63: Campus CURSOS CT CT CT Engenharia d
- Page 64 and 65: Campus CURSOS PG PG TD Tecnologia e
- Page 68 and 69: 4.12 Dados Socioeconômicos e Educa
- Page 70 and 71: A tabela 16 apresenta os dados refe
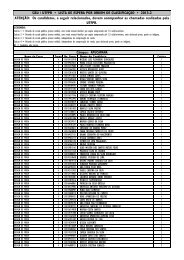
- Page 72 and 73: Classificação dos candidatos por
- Page 74 and 75: Formação dos candidatos no Ensino
- Page 76 and 77: Classificação dos candidatos por
- Page 78 and 79: Classificação dos candidatos por
- Page 80 and 81: Classificação dos candidatos por
- Page 82 and 83: Candidatos Portadores de Necessidad
- Page 84 and 85: Matrículas no 2º semestre de 2007
- Page 86 and 87: Material Aquisição de Acervo em 2
- Page 88 and 89: Periódicos Diversos (1) CD-ROMs Ma
- Page 90 and 91: Tabela 42 - Cadastramento da biblio
- Page 92 and 93: • O reconhecimento das turmas da
- Page 94 and 95: O Quadro 2 mostra as metas selecion
- Page 96 and 97: Corpo Discente fato, o aumento obse
- Page 98 and 99: 56 54 52 50 48 46 44 42 40 45 Núme
- Page 100 and 101: Ano 120 100 80 60 40 20 0 Número d
- Page 102 and 103: Tabela 9 - Número de bolsas de ini
- Page 104 and 105: 2.6 Produção Científica A produ
- Page 106 and 107: 1. PLANEJAMENTO DE METAS 2007 As me
- Page 108 and 109: Objetivo: Cadastrar os formandos e
- Page 110 and 111: Meta 7 Conselho Empresarial - Reali
- Page 112 and 113: Meta 11 Relações Internacionais -
- Page 114 and 115: Meta 15 Empreendedorismo - Organiza
- Page 116 and 117:
Meta 18 Educação Continuada - Rea
- Page 118 and 119:
Meta 20 Eventos - Aumentar em 5% a
- Page 120 and 121:
Objetivo: Estruturar os convênios
- Page 122 and 123:
2. RELATÓRIO DE GESTÃO DO SISTEMA
- Page 124 and 125:
Um dos fatores que contribuiu para
- Page 126 and 127:
Campus Docentes envolvidos Adm. env
- Page 128 and 129:
2.6 Desenvolvimento de Convênios e
- Page 130 and 131:
Campus Nº de serviços Clientes at
- Page 132 and 133:
Instituição. Em 2007, foi eleito,
- Page 134 and 135:
Tabela 16 - Histórico Hotel Tecnol
- Page 136 and 137:
2.10.2 Atividades externas que fora
- Page 138 and 139:
implantada por meio de cursos, pale
- Page 140 and 141:
PRÓ-REITORIA DE PLANEJAMENTO E ADM
- Page 142 and 143:
Quadro 3 - Síntese das metas relac
- Page 144 and 145:
Quadro 9 - Síntese das metas relac
- Page 146 and 147:
2. RECURSOS HUMANOS Para a área de
- Page 148 and 149:
Campus Ensino Médio/Técnico Gradu
- Page 150 and 151:
1200 1000 800 600 400 200 0 Demonst
- Page 152 and 153:
Item Categoria Funcional Quantidade
- Page 154 and 155:
2.8 Demonstrativo das Funções Gra
- Page 156 and 157:
Quadro 18 - Campus Campo Mourão C
- Page 158 and 159:
Vaga Dados do Concurso Data Nome do
- Page 160 and 161:
Código Vaga Dados do Concurso Data
- Page 162 and 163:
Código Vaga Dados do Concurso Data
- Page 164 and 165:
Ministério da Educação Universid
- Page 166 and 167:
Campus Tabela 13 - Quantidade geral
- Page 168 and 169:
O aumento do número de servidores
- Page 170 and 171:
600 500 400 300 200 100 0 Demonstra
- Page 172 and 173:
3. AMBIENTES FÍSICOS, OBRAS E REFO
- Page 174 and 175:
Campus 3.1.3 Área segundo a utiliz
- Page 176 and 177:
3.2 Ampliações e Reformas das Ins
- Page 178 and 179:
Descrição das Obras e Reformas da
- Page 180 and 181:
Figura 17 - Regularização do Esta
- Page 182 and 183:
Descrição das Obras e Reformas da
- Page 184 and 185:
Figura 27 - Ginásio de Esportes. F
- Page 186 and 187:
Descrição das Obras e Reformas da
- Page 188 and 189:
Descrição das Obras e Reformas da
- Page 190 and 191:
Figura 47 - Registro de Diplomas. F
- Page 192 and 193:
Campus Saldo Anterior em 31/12/2006
- Page 194 and 195:
4.2.3 Demonstrativo das Importaçõ
- Page 196 and 197:
5.2 Demonstrativo do Consumo de Ág
- Page 198 and 199:
• Substituição das luminárias,
- Page 200 and 201:
5.3.1 Demonstrativo do Consumo de E
- Page 202 and 203:
Campus 2004 2005 2006 2007 Qt. Rama
- Page 204 and 205:
Campus Tipo de Veículo Placa Ano D
- Page 206 and 207:
6. TECNOLOGIA DE INFORMAÇÃO Demon
- Page 208 and 209:
6.3 Rede de Dados 6.3.1 Demonstrati
- Page 210 and 211:
7.3 Organização de Eventos da Rei
- Page 212 and 213:
100% 80% 60% 40% 20% 0% 100% 80% 60
- Page 214 and 215:
Tabela 46 - Demonstrativo da execu
- Page 216 and 217:
8.2 Demonstrativo Sintético da Des
- Page 218 and 219:
Tabela 49 - Demonstrativo de outras
- Page 220 and 221:
8.4 Demonstrativo dos Empenhos Emit
- Page 222 and 223:
8.5 Demonstrativo dos Recursos Orç
- Page 224 and 225:
Meta Física: Servidor Beneficiado
- Page 226 and 227:
Meta Física: Aluno matriculado Pre
- Page 228 and 229:
Curitiba Campus Principais Despesas
- Page 230 and 231:
Natureza da Valor inicial do convê
- Page 232 and 233:
Natureza da Valor inicial do convê
- Page 234 and 235:
8.7 Demonstrativo das Transferênci
- Page 236 and 237:
Campus Reitoria Entidade Cooperante
- Page 238 and 239:
Cornélio Procópio Curitiba Dois V
- Page 240 and 241:
Reitoria FUNTEF-PR Conv. 01/07 FUNT
- Page 242 and 243:
Assim, pela análise dos valores de
- Page 244 and 245:
Campus Curitiba Tabela 77 - Demonst
- Page 246 and 247:
Valor R$ Data do saque Justificativ
- Page 248 and 249:
40,00 20/09/07 60,00 31/10/07 460,0
- Page 250 and 251:
Tabela 86 - Demonstrativo dos gasto
- Page 252 and 253:
Tabela 91- Demonstrativo dos gastos
- Page 254 and 255:
Campus Toledo Tabela 96 - Demonstra
- Page 256 and 257:
9. CONCLUSÕES A Pró-Reitoria de P
- Page 258 and 259:
Prestação de Contas 2007 - Univer
- Page 260 and 261:
17 18 19 20 21 22 23 24 25 26 27 28
- Page 262 and 263:
46 47 48 49 50 51 52 53 54 55 56 57
- Page 264 and 265:
2. Base de Dados para Cálculo dos
- Page 266 and 267:
2.5 Demonstrativo dos Alunos Ingres
- Page 268 and 269:
2.10 Demonstrativo das Bolsas CAPES
- Page 270 and 271:
Prestação de Contas 2007 - Univer
- Page 272 and 273:
DECLARAÇÃO DO CONTADOR Prestaçã
- Page 274 and 275:
Prestação de Contas 2007 - Univer
- Page 276 and 277:
Prestação de Contas 2007 - Univer
- Page 278 and 279:
Prestação de Contas 2007 - Univer
- Page 280 and 281:
Prestação de Contas 2007 - Univer
- Page 282 and 283:
Gestão desta Universidade deve ser
- Page 284 and 285:
Acórdão nº. 3440/2007 - TCU - 2
- Page 286 and 287:
Ouvidoria Criada pela Portaria nº
- Page 288 and 289:
Relatório de Correição Remessa d
- Page 290 and 291:
Remessa de cópia a AGU/MPF Penalid
- Page 292 and 293:
Remessa de cópia a AGU/MPF Penalid
- Page 294 and 295:
Prestação de Contas 2007 - Univer
- Page 296 and 297:
Prestação de Contas 2007 - Univer
- Page 298 and 299:
Prestação de Contas 2007 - Univer
- Page 300 and 301:
Prestação de Contas 2007 - Univer
- Page 302 and 303:
Prestação de Contas 2007 - Univer
- Page 304 and 305:
PRESIDÊNCIA DA REPÚBLICA CONTROLA
- Page 306 and 307:
almejados (impacto da ação). A im
- Page 308 and 309:
qualitativos alcançados e a eficá
- Page 310 and 311:
prejudicando a avaliação da execu
- Page 312 and 313:
ajuste aprofundado das áreas e tur
- Page 314 and 315:
5 - Servidores instituidores aposen
- Page 316 and 317:
1 GESTÃO OPERACIONAL ANEXO I AO RE
- Page 318 and 319:
ANÁLISE DO CONTROLE INTERNO: A ver
- Page 320 and 321:
Exercício de 2007 Exercício de 20
- Page 322 and 323:
superior e de pesquisa científica
- Page 324 and 325:
153029 153178 153019 150149 153251
- Page 326 and 327:
humanos, salientamos que seu quadro
- Page 328 and 329:
Reitoria 100.000,00 09/2005 - TA Re
- Page 330 and 331:
Reitoria 276.409,77 04/2006 - TA Re
- Page 332 and 333:
3.1.1 ASSUNTO - ATUAÇÃO DO TCU/SE
- Page 334 and 335:
Diante do exposto, constatamos, por
- Page 336 and 337:
Campus os custos anuais assumidos p
- Page 338 and 339:
Campus Cargo Quantidade Assistente
- Page 340 and 341:
etária de 6 para 5 anos. Nessa an
- Page 342 and 343:
4.1 FUNCIONAMENTO DE CURSOS DE GRAD
- Page 344 and 345:
orçamento por parte da UJ, com reg
- Page 346 and 347:
c) gastos além da concessão do su
- Page 348 and 349:
uma única vez, para efeito de inco
- Page 350 and 351:
outra empresa credenciada a fazê-l
- Page 352 and 353:
análise, bem como, sobre o efetivo
- Page 354 and 355:
Nessa análise, não foram realizad
- Page 356 and 357:
9.2 SUBÁREA - CONTROLES EXTERNOS 9
- Page 358:
2.3.1.3 DEMORA NA APRESENTAÇÃO DA
- Page 362 and 363:
Jusitificativa: a) Enquanto o Gover
- Page 364:
4.1 Recomendação: Recomendamos à